Global View’s team has communicated to our clients that Global Economic Activity is slowing toward recessionary readings, or indeed has actually entered recession. Obviously, we will not know for sure if and when a recession began, until well after the beginning has passed. As you know, we rely heavily on data that we purchase from the Economic Cycle Research Institute (ECRI). The incoming economic data over the past 6-8 months has unfolded much as the ECRI suggested, albeit at a slower pace than we feared. Nonetheless, most analysts that you see quoted on CNBC and Bloomberg suggest that economic activity is growing at a slow, self sustaining pace.
The purpose of this post is to highlight a few data points that support slowing/shrinking economic activity. This data is all derived independently of the ECRI data, and is purely anecdotal in nature. In no way is this list an exhaustive list of data points that support slowing/stalling economic activity.
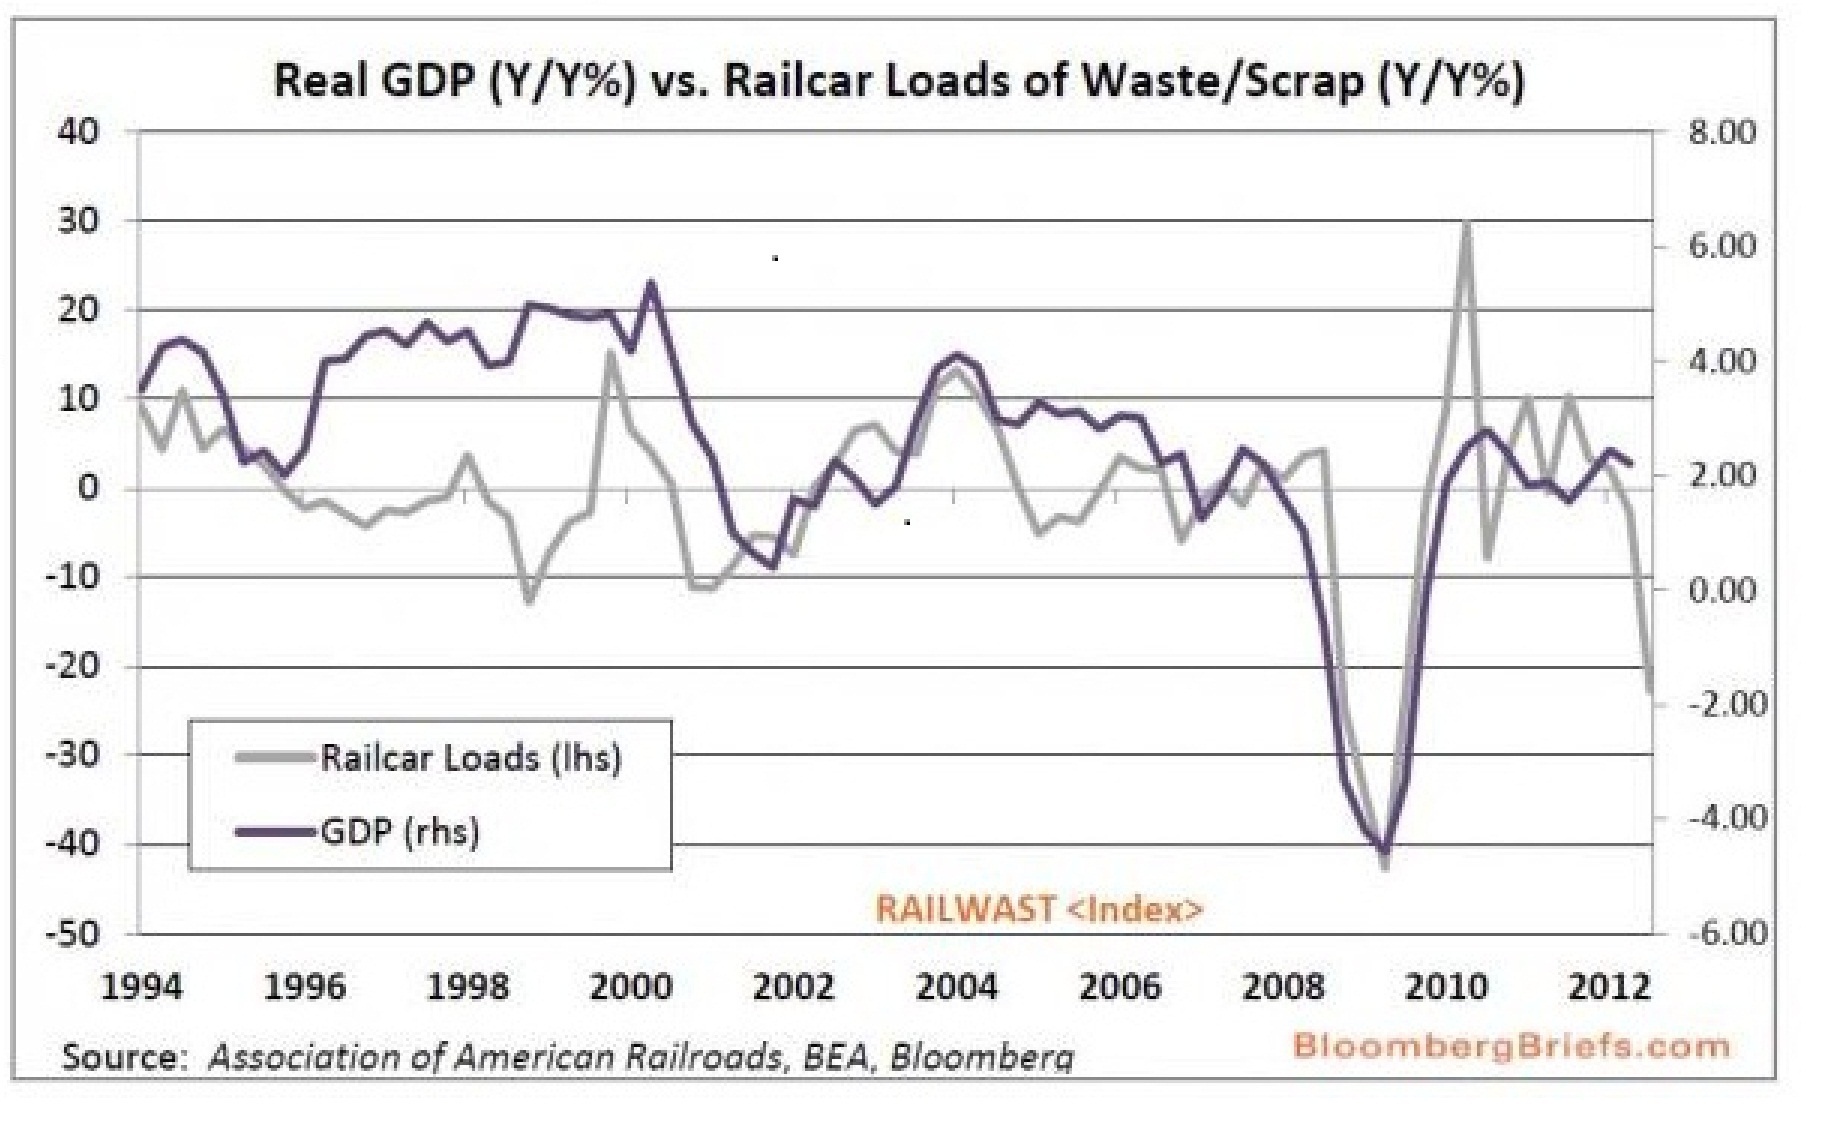
First, the chart below from Bloomberg Briefs, plots rail carloads of Waste and Scrap versus GDP growth. As you can see, the two data series are fairly well correlated. Furthermore, you can see that Waste filled rail car loadings have fallen into recessionary year over year readings. The Y/Y% numbers have been declining since Fall of 2011.
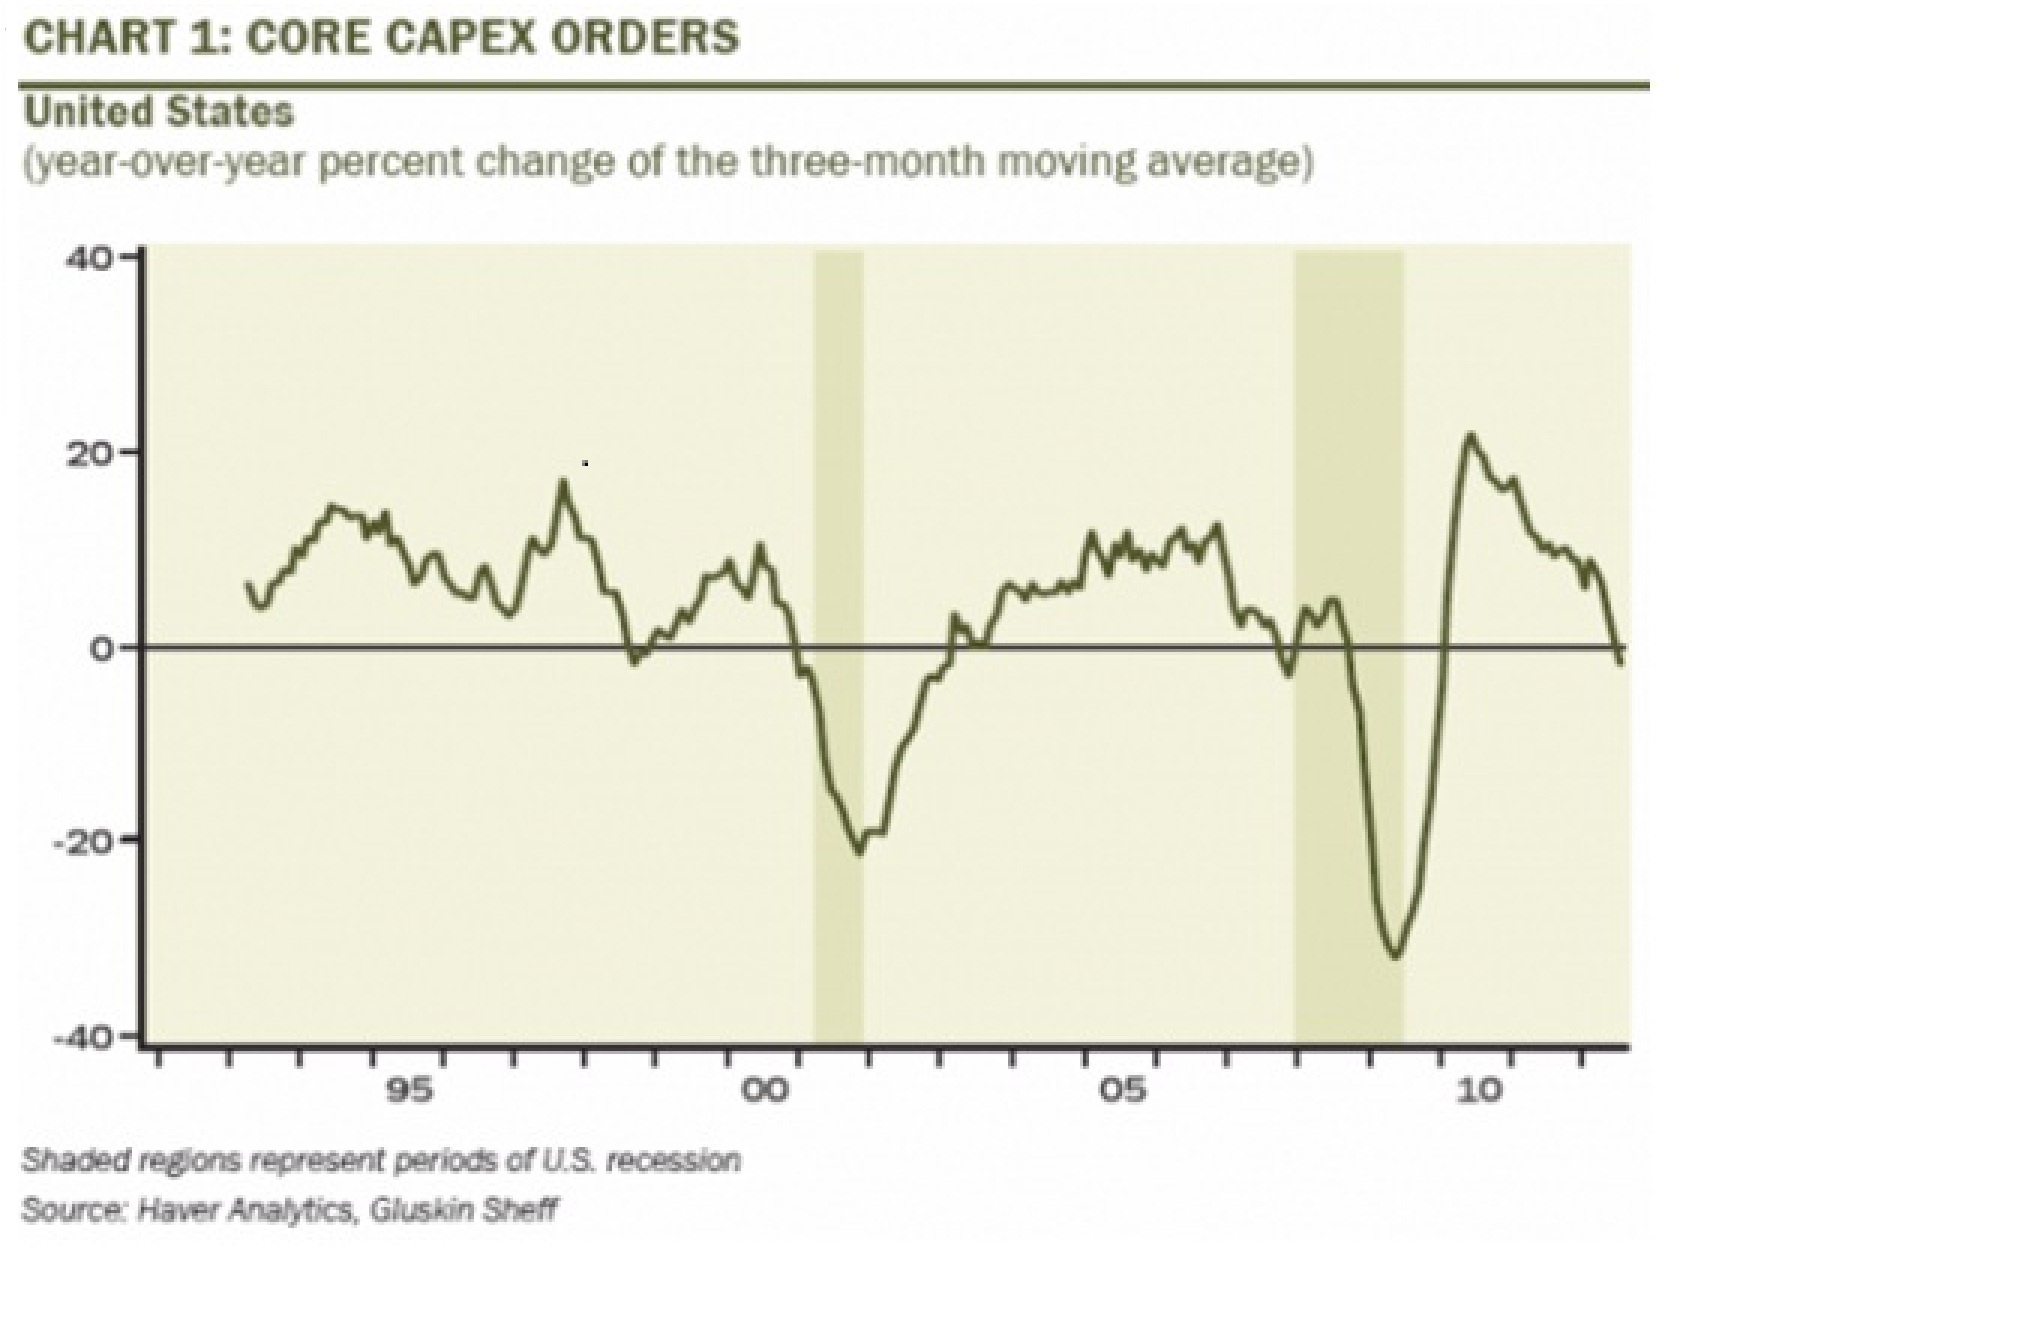
The next chart is courtesy David Rosenberg of Gluskin Sheff. The chart plots the 3 month moving average of Core Capex Orders. According to David, this is one of the best indicators to watch when gauging levels of economic activity. And, this indicator has only turned negative once outside of recession (1998).
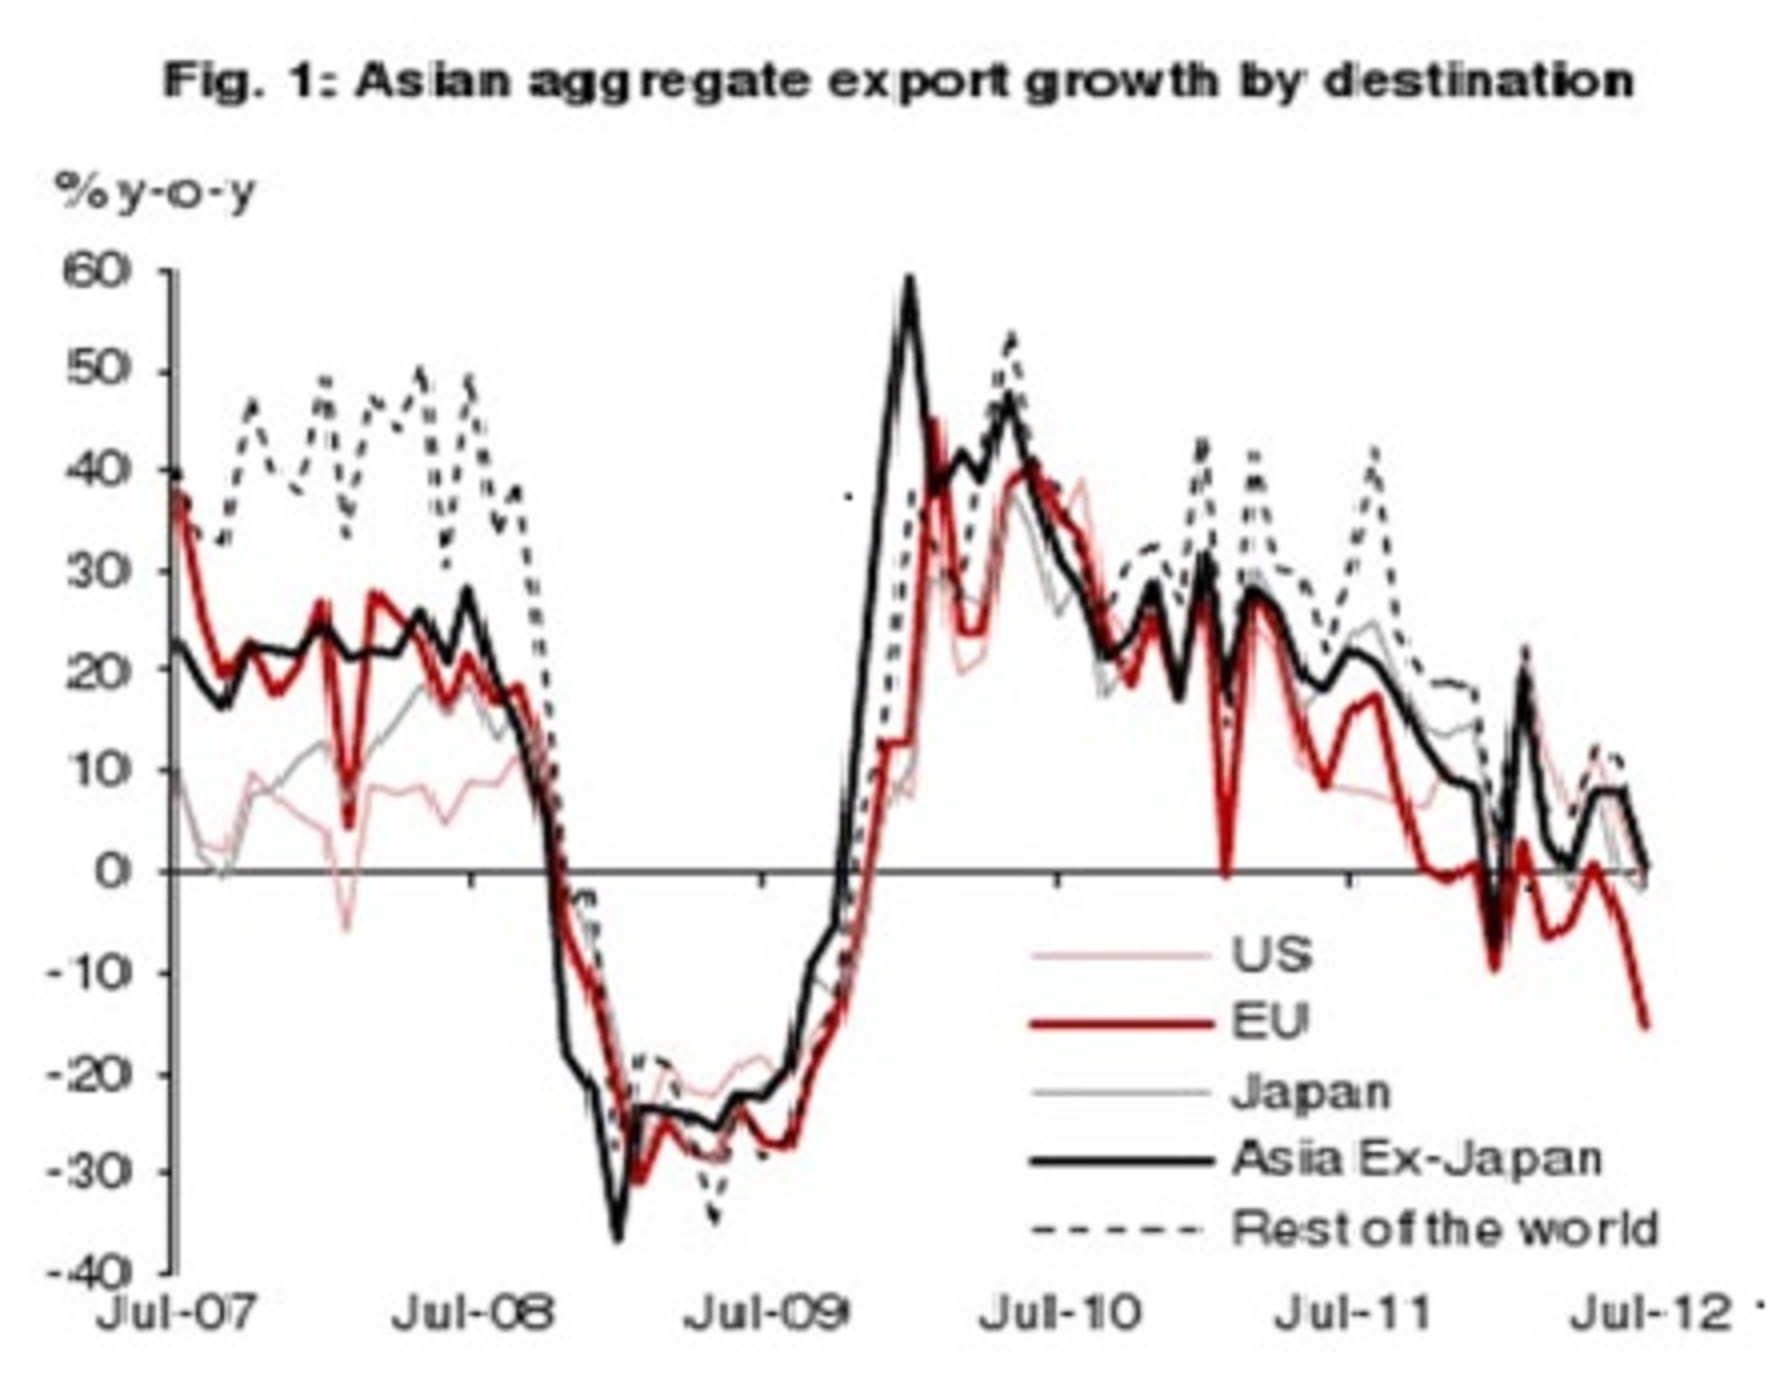
Next, from Nomura's Rob Subbaraman, on Asia's export dive. It speaks for itself:
Rob Subbaraman’s commentary:
“Exports from Asia, the world's manufacturing hub, are often regarded as a bellwether for the health of the global economy. We estimate that the year-on-year growth rate of Asia's aggregate exports turned negative in July for the first time since the global financial crisis (it was negative in January 2012 but was distorted by the Lunar New Year holiday). In examining Asian exports by destination, there is little doubt that a synchronized global economic downturn is in train. It also shows that demand from the EU is weakening more than elsewhere. Asia's export growth to the EU fell from -5.0% y-o-y in June to -15.6% in July, and the trajectory is becoming as steep as during the global financial crisis. Korea is the only country that has released export data for August, which indicated that the global economic downturn is becoming even more synchronized: exports fell to the EU (-9.3% y-o-y), the US (-2.1%), China (-5.6%), Japan (-9.6%), ASEAN (-1.3%) and LATAM (-16.5%), with only the Middle East (+8.4%) bucking the trend.”
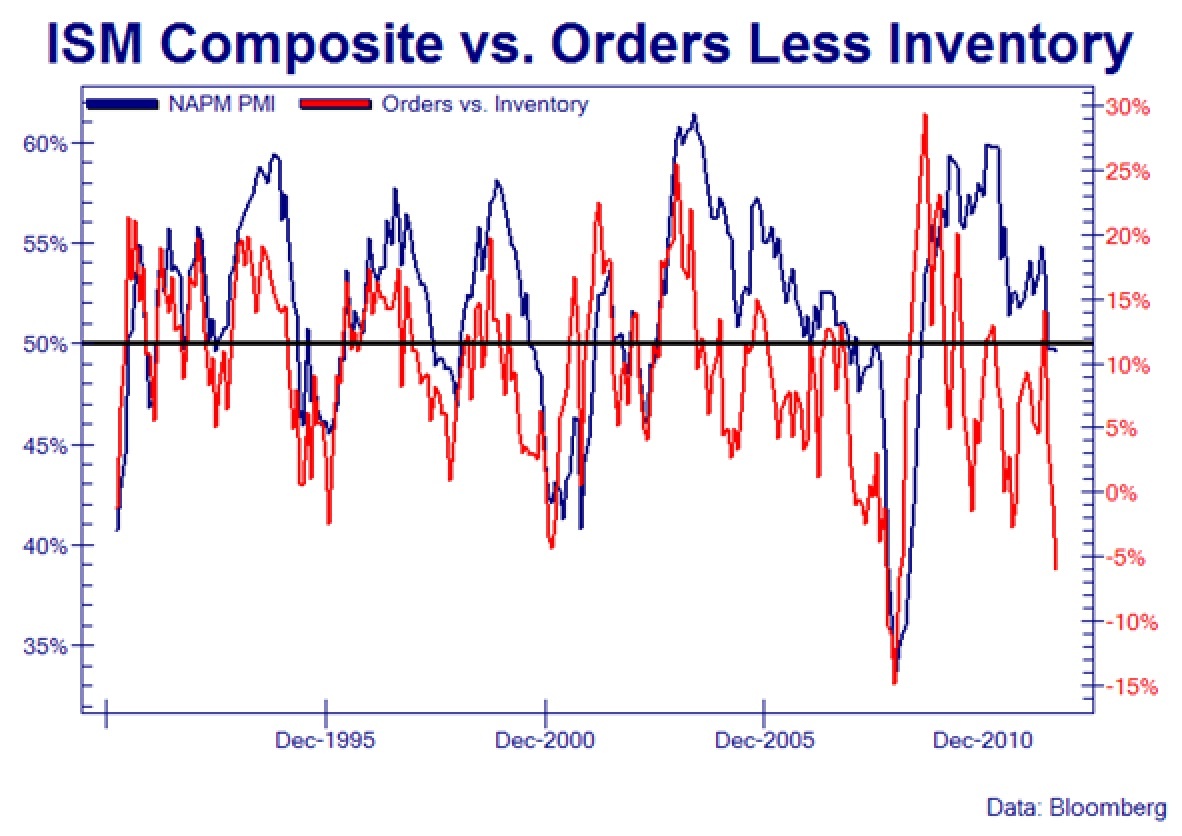
Finally, a chart sourced from Bloomberg. The blue line is the ISM Composite and the red line plots Orders minus Inventory. As you can see, the ISM readings have fallen slightly into contraction, but more striking is the steep decline in Orders minus Inventory. This is a signal that inventory is growing, as sales are falling behind new production.
It is important to note that we are not making any investment decisions based on the data that I am sharing in these charts. I simply wanted to share this information to put our recessionary concerns into perspective. Certainly we can also find data that will not appear recessionary and that will suggest growth continues. Unfortunately, there is no way to know until well after the fact. That is why we have hired ECRI, who has a proven system for sifting through the noise that surrounds real time economic data.
As always, please call or email me with any questions.
Adam Wiles
Partner and Certified Financial Planner