

“Investors take risks because they don’t know what risks they are taking.”
Nobel Laureate Daniel Kahnemann (Behavioral Psychologist)
The Basics (Executive Summary)Using a benchmark is a useful way to track progress. But to work, you need the right benchmark. This means first decide how much risk to bear (equities to own) and only then measure return and risk relative to the benchmark.
The problem is few investors know how much risk to bear because techniques for doing so are flawed. Invalid risk assessments cause investors to take more risk during good markets (when value may be hard to find) and less during bad markets (when value may be abundant). Because this leads to panic selling (remember the Great Recession?), studies show investors leave about half of their returns on the table, for the big banks and life insurance firms to grab.
Recently at the Morningstar conference, we learned most advisors (including robo-advisors) use invalid risk assessments. These advisors are unwilling to ask their clients to spend an extra 15 minutes taking a valid risk assessment. You may remember the scene in the movie Amadeus, where the Austrian emperor, critiquing Mozart’s work, said “there are too many notes.”
Because few lovers of classical music would argue Mozart’s music has too many notes, we persuade our clients to invest 15 minutes to get this right. It’s important because it’s the first step to prevent transferring your wealth to the big banks and life insurance firms.
Most investors fall into 3 risk groups:
- Moderately Conservative: take 30% of the risk of stocks
- Moderate: take 50% of the risk of stocks
- Moderately Aggressive: take 70% of the risk of stocks
Instead of benchmarking to 25% of the world GDP (the US) we use a world stock index.
- Moderately Conservative: 30% MSCI World index (world stocks), 70% US bonds
- Moderate: 50% MSCI World Index, 50% US bonds
- Moderately Aggressive: 70% MSCI World Index, 30% US bonds
We have found that investors are generally comfortable with an asset allocation range of + or - 10% of their risk target, which means we reallocate regularly to make sure we are in bounds.
Our goal is to make you a smart investor. And our clients, who are smart investors, are not the kind of people that transfer their wealth to a big bank or life insurance company.
Digging Deeper – How We Allocate Risk and BenchmarkWhy benchmark?
Investors want feedback to know if their strategy is on track.
Measuring performance against a benchmark is an effective way to get feedback on return and risk.
Sadly, most investors use the wrong benchmark. First, they don’t measure risk correctly. Second, they take more risk than they should because they don’t know how much risk they are taking. This is because the pain of downside risk is not in recent memory, which means you don’t recognize an investment’s risk until after the risk happens! If you had serious money in 2000 or 2007, you know what I’m talking about. Remember the Great Recession?
Finally, most investors benchmark solely on the US market, when the US market represents only about 16% 25% of the global economy (depending on how you measure it). I know what you are thinking, but many overseas companies are lower risk than their US counterparts because they are cheaper. If you doubt me, remember Jean-Marie Eveillard (and his similarly minded global all cap brethren) made positive returns from 2000-2002 and had more consistent returns with lower risk even during the Great Recession. He did this by appropriate owning overseas and US stocks!
The true risk investors bear is clear only when the market crashes, like from 2000-2002 or from 2007-2009. And this risk is worst in common stock indexes because they are price-weighted or momentum based, which means they go up the most and they go down the most.
We have even seen many investors tell us they are “conservative” with a 100% exposure to US stock market indexes. They must mean “conservative” means avoiding smaller companies or overseas stocks. In our world conservative means cheap (or undervalued to be precise).
Investors with 100% exposure to US stocks often change their mind about risk after seeing this chart. Investors in March of 2000 suffered a 44% drop, recovering their original investment only in 2006. And then they saw another drop of over 50% from 2007-2009. Which means these investors would have literally have in the red until 2012. That’s 12 years.
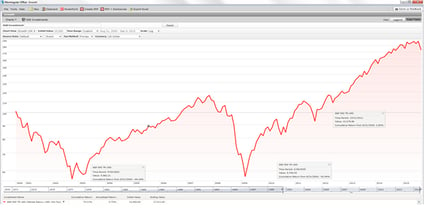
Not shown, even balanced portfolios took a substantial time to recover after these events and recovered if and only if investors didn’t sell.
This is a useful tool to help overly zealous investors readdress their attitude toward risk, at least for their serious money, the money they don’t want to lose and not make back. Because they might need this to supplement retirement income, or they might want to leave it to heirs.
The chart below (courtesy Morningstar) shows the cost of selling in March of 2009 and waiting a year to reinvest (dark blue line). An investment of $100,00 at the beginning of 2007 would have fallen under $55,000 and recovered to $100,000 only by 2014 (7 years later). Of course the investor who bailed and never invested again locked the loss in (green line).
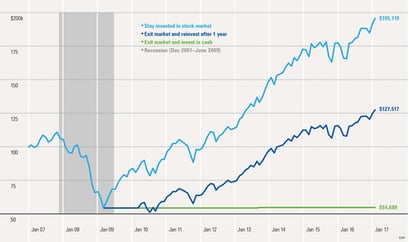
This is a useful tool to dissuade investors from engaging in market timing.
Most investors with assets on auto-pilot in retirement plans (401k) did not feel this pain. But asset rich investors close to retirement panicked and sold. They lost money they could never make back, meaning they had to defer retirement.
Whether they were convinced to buy life insurance or an annuity, or just went to cash, effectively they transferred their heirs’ wealth (or potentially worse their ability to have the retirement they wanted) to big banks and insurance companies.
We have seen this story unfold many times. We have seen annuities issued in 2000 which have not appreciated after fees and we have seen investors who have not made any money in over 15 years.
The risk you take while you are accumulating wealth and investing monthly is not the same as the risk you take when you have already accrued serious wealth. Serious wealth is wealth you don’t want to lose and not make back.
Setting a Risk Budget
Although we happily help qualified clients accumulate for retirement, most of the assets we manage is serious money with a focus on loss avoidance first and foremost. This does not mean we don’t want high returns. It only means we aren’t willing to take them at any price. For this reason, we need to accurately assess your risk.
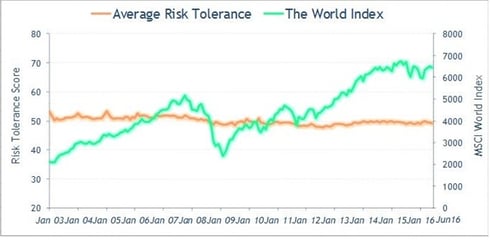
Our methodology for is simple. First, we determine your attitude toward risk by giving you a valid risk assessment. A valid risk assessment is one which holds true over time and incorporates psychology and statistics (psychometrics – sorry for the jargon). In other words, it will stay the same unless a life event occurs. For instance, if a client becomes seriously ill we would expect their risk tolerance to be reduced. Similarly, if a client inherits a hefty sum of money this might also affect their risk tolerance.
Few investors have taken a valid risk assessment. Even Morningstar (and most robo-advisors, 401k plans etc.) use overly simplistic risk assessments that are simply not valid. Joey and I were surprised to see this is still true. Unfortunate. At a recent Morningstar investment conference, behavioral finance was highlighted but this fundamental problem was not specifically addressed. This means investors take more risk than they should after markets have done well and less risk than they should after markets have done poorly. These questionnaires typically have six questions and only take 2-3 minutes to complete. In my opinion this is mind numbingly stupid. Because it can be avoided if you are not worried about the Austrian emperor’s problem with Mozart’s music, that “it had too many notes.”
By taking an additional 10-15 minutes you can to get a valid and reliable assessment or risk tolerance. Classical music lovers today are unlikely to believe Mozart’s music has too many notes. FinaMetrica, in Australia, devised a risk assessment that is proven to be both valid and reliable.
As the chart below shows, the average score has been close to 50 (the average between 0 and 100) since 2003.
Allocating Risk
Based on this work, most investors (86%) of investors fall within one of three risk groups. 86% of clients fall in Risk Group 3, 4, or 5.
7% of people fall below risk group 3. These people make poor investors and typically should have only
15% of their assets allocated toward risk. Another 7% of people take more risk than Risk group 5. These investors are often thrill seekers. They need education to invest well. 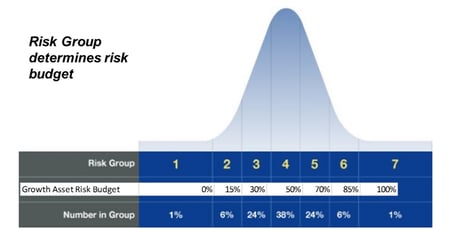
In simple terms, we expect risk groups to bear risk proportional to their asset allocation:
- Risk group 3: 1/3 the risk of stocks and lower return expectations
- Risk group 4: 1/2 the risk of stocks and moderate return expectations
- Risk group 5: 2/3 the risk of stocks and higher return expectations
I know what you are thinking, this is too simple. But if you are tempted to customize these you might want to know that even John Bogle (Vanguard) agrees with this grouping. In fact, at the Morningstar Investor conference in Chicago, Joey and I saw Mr. Bogle specifically advise clients to take 30%, 50% or 70% of the risk of the market. Unfortunately, he, like Morningstar and nearly all advisors, did not recommend a valid risk assessment. This is sad because without this important first step a lot of wealth will be transferred to big banks and life insurance companies.
After this important first step, we work with our clients to model odds of winning against a future goal by learning their capacity to take risk. For accumulators in retirement accounts, who won’t be using funds for many years, we coach clients to move up to a higher risk group. The longer the time horizon the more predictable the return and the lower the odds of catastrophe. Which means investors who tested in group 4 can be coached to take the risk of group 5, because they have the capacity to weather an inevitable drawdown.
Similarly, a retired investor taking high withdrawals for income might be coached down a notch. Because a larger drawdown could cause a retiree to run out of money, this needs to be considered. This means even when a retiree can afford to take more risk, his odds of success doing so are less, which
means the retiree needs to weigh the importance of leaving a larger legacy against the odds of running out of money. We ask, simulate (using quantitative methods), and discuss before we agree on a risk group with our clients.
The key point is that we start with a valid and reliable risk assessment (unlike everyone else). And then we coach to an appropriate allocation based on your specific needs.
Managing Real vs. Perceived RiskBecause each risk group takes a predictable level of risk, we can further coach to minimize surprises. Surprises trigger emotional reactions that can cause panic selling. By minimizing these surprises, we reduce or eliminate the investor behavior gap, which is just the amount of wealth transferred to institutions like big banks and life insurance companies.
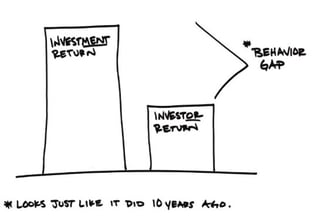
While there is some debate on the size of this gap, authorities agree the job of an investment advisor is to reduce it. When panicked investors sell, it is essentially a transfer of wealth from the panicked investor to big bank brokers and life insurance companies (who are educated on this and take advantage of it).
It’s our job to prevent this from happening because as a smart investor, you are not the kind of person who transfers wealth from heirs to the big banks and life insurance companies!
Firms such as Morningstar and Vanguard agree investors add well beyond their fee. Russell investments states the value of coaching alone is 2% per year, and that planning, tax consciousness and rebalancing add another 2% for a total of 4% per year.
Showing you the expected level of risk over a short-term six-month period helps to eliminate surprises. 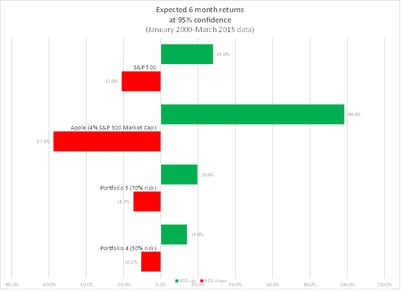
This means investors in the US market (Vanguard S&P 500 index fund for instance) would expect to lose 21% or make 28% over any given 6-month period (at 95% confidence).
Portfolio 4 (Moderate) investors, if taking half the risk of the market, would expect to be down only 10.5% but up only 14%. This means these investors would expect a $1,000,000 initial portfolio to be between $1,140,000 and $895,000.
At the Morningstar conference in Chicago, we learned few advisors use tools to engage clients and educate them on risk. Below is a video of one tool we use (skip to 4:45 for the $4,000/$3,000 game). After taking this test you will know (in your gut) that you simply are not wired to be a good investor.
For more information, watch Educating Clients to Avoid Losing Money You Can't Make Back
We are exploring other ways to educate clients because it is imperative we do what we can to help you avoid losing money you can’t make back, and transfer your heirs’ wealth to the big banks and life insurance companies.
Reallocating to Risk Budget
As we do reviews we revisit asset allocations to make sure they are in line with your risk budget and if appropriate re-assess your attitude toward risk (retake the risk exam), your risk capacity, and any life changes which may have taken place. Clients are happy to be within a risk budget of plus or minus 10%:
- Portfolio 3: 30% budget - between 20% and 40% range
- Portfolio 4: 50% budget – between 40% and 60% range
- Portfolio 5: 70% budget – between 60% and 80% range
When investors fall below their comfort range or get above it they are likely to become uncomfortable, which means we need to reallocate regularly. And because we spend a lot of time finding new ideas this is a great time to implement them while also minimizing taxes and trading costs.


.jpeg)


.jpeg)


