

“Any continued rise in prices is dangerous because, once we begin to rely on its stimulating effect; we shall be committed to a course that will leave us no choice but that between more inflation, on the one hand, and paying for our mistake by a recession or depression, on the other.”
Friedrich A. Hayek
Executive Summary
Since our last newsletter, official data has continued to weaken. However, literally unprecedented central bank interventions have caused risk asset prices to continue to rise. The Great Recession was the first stage of a new Deleveraging cycle analogous to the Great Depression. While there has been progress since 2009, the ability of the US and other governments to continue navigating without an air pocket becomes more difficult especially in lieu of inability to resolve fundamental problems in Europe.
- The long-term inflation adjusted trend of the stock market suggests stocks are overvalued.
- The deterioration of economic activity toward a global recession continues. Moreover, year on year growth patterns are disturbingly similar to late 2007 and early 2008.
- Markets have not responded to fundamental deterioration in earnings but instead to Central Bank actions a situation we do not believe is indefinitely sustainable.
- Our portfolios continue to take low risk and will do so until we believe there is a substantial improvement in the global economic outlook.
Deleveraging Backdrop
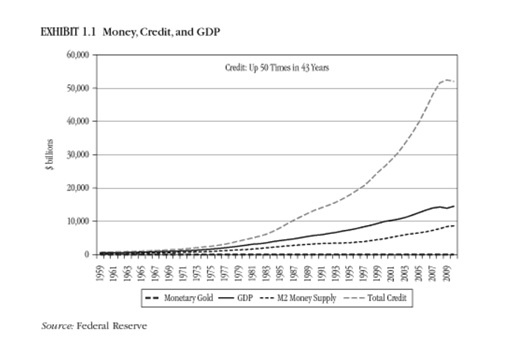
Everybody knows about the global debt problem in general terms but few grasp the true nature of the credit  bubble that grew from 1968 when the US dropped the gold standard, through 2007. In The New Depression, published earlier this year Richard Duncan explains that credit expanded from about $1 trillion in 1968, to $52 trillion in 2007, substantially above economic growth.
Austrian economists label this expansion in credit as a credit boom and tell us that after every credit boom there must be a credit bust.
The first round of quantitative easing did not take place in the US but in Asia. From 2000 to 2008 the Bank of Japan, The Bank of China, the Central Bank of Taiwan, and the Bank of Korea created about $5 trillion in new currency with which they primarily bought US assets (bonds and stocks). This helped asset prices to continue to rise from 2003 to 2007.
The next round of quantitative easing, (which we call QE 1) took place after the Financial Crisis when the US Federal Reserve, The European Central Bank, the Bank of England and the International Monetary Fund created the equivalent of trillions of additional dollars. This round of easing was completed by the end of 2009 and may have helped asset prices stop falling in early 2009 and resume rising. Following QE2 and Operation Twist, the US Federal reserve announced it will continue QE Infinity, purchasing at least $40 billion per month in agency mortgage-backed securities and keeping the federal funds rate between 0 and 0.25% until at least mid-2015.
Ray Dalio, the founder of Bridgewater Associates, a prominent hedge fund that navigated its clients well through the crisis of 2008, uses the term “Deleveraging” to describe the credit bust period where natural credit growth has stopped and where governments often intervene to reduce the near term pain that a painful, or “ugly” Deleveraging can bring, often resulting in social unrest. Deleveragings are distinct from recessions in that they continue until debt/ GDP ratios drop to tolerable level primarily through a combination of austerity and debt monetization. Ray believes we are currently in a Deleveraging similar to the Great Depression in the US, the lost Decade in Japan, and Post WWII United Kingdom. Deleveragings can be “ugly” where debt is exhausted but GDP declines or “beautiful” where debt is reduced as a ratio to GDP but where absolute credit growth, and subsequently economic growth, continues. Please note that there is nothing truly “beautiful” in any Deleveraging and that intelligent people may believe that it is amoral for a government to act in this fashion. Our role as investment advisor is not to study morality but instead to give a pragmatic assessment of what we see.
Looking at historical Deleveragings is instructive. Ray Dalio believes the US Deleveraging, which began in 2008 with the Great Recession, turned from “ugly” to “beautiful” when the US embarked on a policy of extraordinarily easy monetary policy including quantitative easing, which reduces interest rates. According to Ray, the US continues to experience a “beautiful” Deleveraging which could turn ugly should our economy hit an air pocket. Avoiding air pockets, from his view, is accomplished through a perfectly balanced combination of austerity and debt monetization (easy money and quantitative easing).
We now know, from looking the latest Federal Reserve flow of funds data, that Credit Growth in the US has resumed, and that the US “beautiful” Deleveraging appears to be continuing. We also know that the US Federal Reserve appears intent on continuing this process for some time. According to Dalio, “beautiful” Deleveragings have been accomplished twice in history: during the Great Depression and in Post WWII United Kingdom. In both instances, the ratio of Debt to GDP was reduced largely through a combination of austerity and easy monetary policies. Right is a table illustrating the degree this ratio was reduced. Thus far, we have only reduced the ratio by 9% and appear to have a long way to go, especially if we consider off balance sheet debts, i.e. future Social Security and Medicare obligations. The chart below shows 3 “beautiful” and 4 “ugly” deflationary Deleveragings.

It is important to underscore that these Deleveragings remain “beautiful” only under perfect conditions. During the initial phase of the credit bust, the ratio of debt/GDP climbs. This happened during the beginning years of the Great Depression, during the initial phase of the Great Recession, and continues to go on both in Spain and in Japan. The other ugly Deleveraging was hyperinflationary, in Weimar Germany and resulted in a 100% elimination of debt as currency became worthless.
We cannot know if the current US “beautiful” Deleveraging can be continued or whether there will be disastrous unintended consequences. We do know that this distortion in interest rates has caused a misallocation of capital and believe that only when this is corrected can the private economy grow at its true potential. Moreover, it seems clear that Europe is incapable of pulling off a “beautiful” Deleveraging because there is no central fiscal authority capable of doing so. Spain, in particular, is mired in a Depression that continues to worsen and does not have the authority to take the hard medicine required on its own because the Spanish government cannot devalue its currency or print its own currency because Spain left the Peseta in 2002 to join the European Monetary Unit (Euro).
Instead, European Union country members depend primarily on Germany. Actions taken thus far have been woefully insufficient. It remains to be seen whether German citizens, who just suffered their own period of austerity during the German Reunification, will be willing to do pay for what they consider to be others’ folly. Therefore, Europe may face a prolonged depression. It remains unclear how this will affect the United States and whether it will result in civil disorder … but at best this is not likely to end well. Therefore this situation is worthy of close monitoring.
In terms of price movement, the current “beautiful” Deleveraging, at least in the United States, has been phenomenal at least for owners of risky assets. Equity rallies have coincided with Federal Reserve action since early 2009. We know, however, that, even during previous “beautiful” Deleveragings, there was substantial volatility. During the period from 1933-1937 the US stock market corrected over 10% on several occasions, although the general price movement was upward.
The chart below illustrates the general trend of the US stock market since 1871 and periods of relative over and undervaluation. Of note, the US market traded substantially below its trend during the Great Depression and during the 1970s stagflation. However, the market has not traded below that trend since 2000 with the notable exception of early 2009. We believe this is likely due to the unprecedented global quantitative easing that began in 2000 in Asia and remains ongoing. Looking forward, the question is whether this long-term trend line will hold. If it does it is like there will be a major correction in prices at some point. Since this chart is shown in inflation-adjusted terms we think this is much more likely than a change in the trend.

Move toward Global Recession Continues
Despite what one might observe from recent activity in the stock markets, economic activity has continued to deteriorate globally. Year on year growth patterns appear disturbingly similar to late 2007/ earlier 2008 in developed markets. 
However, as we addressed in our last newsletter, economists tend to understate the degree to which coincident economic indicators are later revised. Remember, ECRI called the recession of 2008 in April, when the Bureau of
Economic Analysis reported positive GDP for Q1 2008. Q1 GDP was initially revised up, and was not revised downward until well over July of 2009. Therefore, it is entirely plausible that ECRI was right, and that Q2 2012 will be when the recession of 2012 began.
On September 27, US Q2 GDP was revised down from 1.7% to 1.3%, as ECRI predicted. While there is likely to be further noise in revisions, ECRI holds strong, below from a recent report:
Consider the facts. In three of the last 15 recessions – specifically, in 1980, 1945, and 1926-27 during the Roaring Twenties – stock prices remained in a cyclical upturn. Of course, in 80% of those 15 recessions there were cyclical downturns in stock prices. So, while recession does mean high risk for equities, it does not guarantee a stock price downturn. Then there is the worst recession in the last 100 years, when stock prices peaked only after the recession began in August 1929. No doubt, equities have done well in recent months, but is that because of the economy’s strength, or is it about central banks?
 While the new U.S. recession is ECRI’s most high-profile call, we have made a number of other key forecasts this year. In April, we predicted an upturn in U.S. home price inflation, as well as a downturn in global industrial growth – and we have been consistently pessimistic about Chinese growth all year.
Some believe that our own Weekly Leading Index contradicts our U.S. recession call. This is not the first time that charge has been made. Recall that, a couple of years ago, people said that its movements guaranteed a double-dip recession. At the time we flatly and correctly rejected that interpretation. Today we can tell you that the Weekly Leading Index is not pointing to recovery and, more importantly, this is also the message from our full array of leading indexes.
For the U.S., the economy is recessionary despite all of the extraordinary efforts by the Fed over the past four years. In that sense, one might argue that, as far as the economy is concerned, the Fed’s actions have become increasingly ineffective. The plunge in the velocity of money to record lows tells us that the Fed is pushing on a string – so no matter what they do there will only be limited traction. Basically, the recession has to run its course.
Another reason for avoiding risk during recession, and worth repeating, is that the worst bear markets occur during recessions (see chart above). Even if we can somehow continue with a “beautiful” Deleveraging in the US, the US stock market corrected 49% between March 10 of 1937 and March 31 of 1938 when the Deleveraging ended. In the interim there was substantial volatility.
Markets are not responding to Fundamentals
We seek to avoid permanent loss of capital. Stock markets have continued to rally in the face of deteriorating fundamentals, likely as a result of ongoing global easy money and attempted debt monetization. 
As previously in an earlier post, Deferred Alpha , the US stock market is the most overpriced major stock market on a cyclically adjusted basis. Moreover, the recent rise in stock prices has come as a result of expanding price to earnings multiples instead of expanding earnings. This has never happened before and makes us highly suspect that it can continue.
High Risk in Stocks and Bonds
We continue to believe a global recession is highly likely and may result in a serious correction in risk asset prices, i.e. stocks, high yield bonds, and commodities. The unprecedented easy monetary policy, coordinated globally by the US Federal Reserve, the European Central Bank, the Bank of Japan, the Bank of England and coincident with stimulus infrastructure spending in China has created a bubble in prices of both stocks and bonds that may be shocking in its expiration.
Normally, if stocks were overvalued then bonds (long US treasuries) would be cheap. Conversely, if bonds were overvalued then stocks would be cheap. Historically, however, during Deleveraging periods with easy monetary policy, so called “beautiful” Deleveragings, both stocks and bonds do well. However, even some bond gurus, such as Jeff Gundlach, have said that they believe the bond bull market is over, i.e. that the easy money to be made from falling interest rates is done. We are at a crossroads within which we strongly prefer to take very little duration risk, credit risk, or equity risk.
Next Steps
Despite adverse performance vis a vis market indexes, our clients understand the level of risk in these markets and agree it remains prudent to continue taking low risk. While it is possible that these unprecedented steps to monetize the debt will be successful, a near term crisis avoided, and the “beautiful” Deleveraging continue, we do not like to base investment strategy on hope.
Therefore, it is more important than ever to be prudent and constantly vigilant. We believe the signals we receive from the Economic Research Cycle Institute will prove invaluable in warning where potential air pockets exist and will feel comfortable taking additional risk only when we feel the global economy is once again expanding.
In the short term, we believe deflationary forces are stronger then inflationary forces due to the slowing economy. When the expansion ensues, and when income and GDP growth begins rising, we expect inflationary forces to take over.

Written by Ken Moore
Ken’s focus is on investment strategy, research and analysis as well as financial planning strategy. Ken plays the lead role of our team identifying investments that fit the philosophy of the Global View approach. He is a strict adherent to Margin of Safety investment principles and has a strong belief in the power of business cycles. On a personal note, Ken was born in 1964 in Lexington Virginia, has been married since 1991. Immediately before locating to Greenville in 1997, Ken lived in New York City.
Popular posts
-
 How to Calculate Your Break-Even Age June 21, 2021
 -
 2025 Year-End Tax Planning Checklist November 21, 2025
 -
.jpg) Roth Conversions: When They Make Sense and What You Should Consider January 07, 2026
Roth Conversions: When They Make Sense and What You Should Consider January 07, 2026 -
 One Big Beautiful Bill Act: Key Tax Changes You Should Know November 26, 2025