

Quarterly Newsletter to Public Q2 2013
July 15, 2013
“When people believe things are permanent, they act one way. When they believe things are not they act differently.”
Milton Friedman’s Permanent Income Hypothesis
This quote, originally in reference to temporary tax cuts, is highly appropriate to the new realization that monetary stimulus cannot go on forever. The Fed made this clear in their statement on May 22 to “taper” its monetary stimulus program.
Executive Summary
The view of many investment professionals we admire is that global central banks have created a “rigged market,” where stock prices have gone up despite a recessionary economy. Since these unprecedented actions, asset prices have responded almost immediately when any directional change in policy has even been suggested. The Fed decision to “taper” bond purchases is its first suggestion of an exit strategy and has wide ranging implications for asset markets including substantially increased volatility.
- While the mainstream media continues to trumpet an upturn in the US economy, we do not yet have sufficient evidence to support this. The only thing we know is that recent economic growth has been lower than forecast and despite this asset prices have risen.
- Central Banks monetary stimulus or “Quantitative Easing” have caused a distortion in asset prices, causing stocks to rise further than warranted based on fundamentals.
- The recent decision of the US Federal Reserve to exit monetary stimulus is a game changer implying an imminent return to the relationship between economic fundamentals and asset prices. When this happens may be a function of when the “taper” actually starts.
- There are three basic scenarios that we see may unfold: an improving economy with rising rates, a continued slow or recessionary economy with stable rates or, an increasingly deteriorating economy with lower rates.
- Our recent reallocation efforts substantially reduced exposure of Volatility Control managers to interest rate risk should prove beneficial in all of these environments. We believe this will be fertile ground for positive returns.
- We are ready to respond depending on how things play out and remain conservatively positioned in all portfolios.
Global Economic Outlook
Much of the media continues to trumpet an imminent upturn in economic growth. A prominent researcher recently said that if you ask an economist what economic growth will be next year, the answer is always 3.5% (real GDP) because that is the long-term historical average. These forecasts have been consistently wrong and nonetheless the investing public continues to believe them. The fact is, looking in the rear-view mirror, the economy has been much weaker than anyone expected or forecast.
Moreover, GDP, even after its 3rd revision in Q4, was reported to be 0.4% (real) assuming annual inflation of about 1.3%. Similarly, real GDP for Q1, 2013 was revised down to 1.8%. Economists at major brokerages have now reduced their Q2 2013 GDP to 1.0% or below. In any case, this is slow growth (at best) is far below the bullish 3.5% hockey stick forecasts.
The question on everyone’s mind is the economy turning up or down? The answer we receive from ECRI is no upturn insight for the US economy. However, another prominent economist we admire believes we may, emphasize may, be on the cusp of an economic upturn. Therefore we are monitoring this closely. In our opinion the recent statement by the US Federal Reserve that they plan to end Quantitative Easing is also very important because we know that stocks have risen despite a deteriorating economy not because of an improving one!
“Rigged” Markets – The Effect of Monetary Stimulus
The unprecedented actions of central banks around the world led by the US Federal Reserve have caused a major distortion in asset prices. This is most likely a temporary deviation that will eventually mean revert. Our decision to reduce risk in conjunction with the advent of global recessionary conditions was temporarily thwarted by these actions. It appears this policy manipulation may be coming to an end as the US Federal Reserve recognizes the policy to be ineffective for creating economic growth. We feel very confident that asset prices will eventually reflect fundamentals and believe the end of policy stimulus is likely to hasten this effect.
As we have discussed in prior letters, we believe the credit burst which occurred in 2008 is an event more analogous to what happened in 1929, than to the post WWII recession. As our economy struggles to get rid of excess leverage it must continue to grow faster than the cost of its debt. Higher interest rates, caused by a threat to end Quantitative Easing (QE), combined with low economic growth spell trouble ahead. We believe the Fed is likely to reduce QE because they now recognize it has distorted prices but has not caused positive economic growth, i.e. it is not working.
QE has helped Risk Assets Rise
This chart illustrates the relationship between stocks and the Federal Reserve Balance Sheet (which increases as it buys more bonds). As it clearly illustrates the market has risen in lockstep with the Fed balance sheet.
Balance sheet Expansion has been accomplished by a process called Quantitative Easing (QE) where the government has basically been buying bonds and keeping interest rates low.
The mere suggestion that this monetary stimulus (QE) will be withdrawn caused a sharp rise in rates and a selloff in risk assets as can be pinpointed to specific dates and times. The latest rout occurred on May 22 when the US Federal Reserve first signaled its intention to exit QE. Immediately after this announcement, even minutes afterward, riskier assets started to correct. Because the wording was ambiguous, the US market held up relatively well. However, during the June 19 FOMC meeting the exit promise was underscored and all asset markets reacted negatively, including US stocks.
Some researchers believe it has been the express intention of the Fed to help stock prices rise by creating a “wealth effect.” Thus, the recent sell off caused Federal officials to lower taper expectations in subsequent speeches. Ben Bernanke, Chairman of the Federal Reserve, wrote an Op-Ed published in the Washington Post on November 4, 2010:
“Easier financial conditions will promote economic growth. For example lower mortgage rates will make housing more affordable and allow more homeowners to refinance. Lower corporate bond rates will encourage investment. And higher stock prices will boost consumer wealth and help increase confidence, which can also spur spending. Increased spending will lead to higher incomes and profits that, in a virtuous circle, will further support economic expansion. “
In summary, as the chart below illustrates, since QE was started in November of 2008 until now stocks have risen about 90%, but the periods where QE was withdrawn have resulted in a DROP of 27.5%.

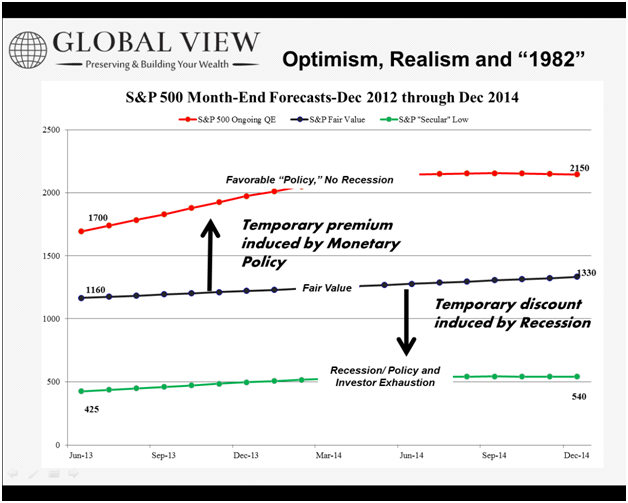
We created a hypothetical chart to illustrate possible scenarios for the stock market through the end of 2014 depending on some basic assumptions. We do not intend for false precision here, but just a conceptual framework. The red line illustrates the Perfect Outcome scenario which is the hypothetical price trend for US stocks assuming that the economy continues to grow and that monetary stimulus is maintained. In order for this to manifest, the economy must avoid recession AND QE must be continued. This is the path every bullish Wall Street investment banks suggest may be possible. However, in order for this to occur, many stars must be aligned. First, earnings must remain high and grow. Earnings as a percentage of GDP hit an all-time high in May suggesting any increase in costs that may follow from inflation in input prices or wages could cause this to drop. Second, they must grow, i.e. the economy must continue to grow at least in nominal terms. Strategist and analysts all suggest earnings will grow because they believe the economy will inevitably grow at 3.5% in real terms sometime next year, and that the current slow growth is “temporary” and that excellent growth is “right around the corner”.

The black line illustrates the Fair Value scenario assuming stocks once again trade on the long-term valuation trend based on historical economic growth. This relationship has held since 1871, however may be overly “bullish” as it assumes economic growth returns to historical rates, a fact disputed by some in this “new normal” economy. One would expect the market to trade somewhat above or below that line, absent distortions.
The green line shows the value one might expect during a recession and when policy has been exhausted. This could be brought about by a nasty recession, a “policy” error, or by a crisis in Europe for example. This line was touched in 1932 and in 1982. Both instances proved to be stellar buying opportunities.
This is a very wide range of possible outcomes. A rational investor might ask, based on the current environment, which is most likely? We believe the red line is now off the table based on the recent announcement of the Federal Reserve to “taper” QE.
Therefore, stocks are likely to trade below that line and move toward the black line. Should a crisis unfold or a nasty recession be recognized, we believe an opportunity will be afforded to purchase stocks at prices below the black line, perhaps substantially below it. What is important to recognize is that we have been in a period without a good historical analogy. Instead, we have been in a period where prices were “rigged”, but this period may be coming to an end.
Over the long run stock prices are driven by fundamental economic growth. This relationship has existed since 1871. Company earnings generally rise and fall with the economy and so do stock prices. We believe this relationship will slowly be restored. Eventually the US economy will experience an economic upturn. Unfortunately, if prices remain high, this will not be a signal to take increased risk, particularly if policy support is withdrawn.
The chart below provides some insight into bubbles created by artificially low interest rates in the past.

For a number of reasons we do not believe this bubble will continue indefinitely. First, we know that the Federal Reserve has already suggested an end to monetary stimulus is imminent. While they have not suggested raising the Fed Funds rate for some time, other interest rates have already risen at this suggestion. Second, nominal GDP growth has already fallen to levels never historically seen outside of a recession. Historically, nominal GDP growth below 3.7% has never been seen outside of a recession. We now know that nominal GDP growth in Q4 of 2012, fell to 1.3%, and to 3.1% in Q1 of this year. Estimates for Q2 are low and dropping.
How Might this Unfold?
It is perplexing that the US Federal Reserve would announce an end to its QE program, when its dual mandate seems far from having been achieved. The US Federal Reserve is tasked with maintaining stable employment and stable inflation. Even the official unemployment number (before even considering the quality of jobs, the substantial drop in employment to population ratio, or the more meaningful median earnings) remains high and inflation is well below its target rate. With inflation below target how can one rationally worry about inflation? It appears deflation continues to be the greater imminent threat and that this threat has been exacerbated by the Fed announcement. However, it is possible that the US economy is on the cusp on an upturn. Ironically, this could cause a stock market correction because it nearly assures the implementation of a taper!
We believe the nearly two year period of low volatility and rising risk asset prices ended with the Fed’s announced intention to exit QE. Fundamentals will slowly be asserted and risk asset prices are likely to re-price, i.e. fall to their long-term trend line and perhaps substantially below it. The last two times QE ended the market corrected nearly 20% before QE was resumed. If you believe the Fed’s mandate is to create a permanent wealth effect, then it is possible that any “taper” will be curtailed when it looks like stocks are about to enter a “bear market” (typically defined as stocks falling 20%). However, it remains to be seen if this will work and how long this will continue to work.
Assuming the Taper is implemented, there are three key ways this may play out:
Scenario 1: Continued Slow Growth or Mild Recession
This is the scenario we were under before May 22 when the Fed Taper was announced. In this scenario the taper is likely to be slowly implemented and the artificial market support at least temporarily removed. We would expect stocks to slowly move toward their fair value, i.e. to fall in aggregate and for stock picking to become more important. Moreover, we believe our Volatility Control managers, in aggregate should experience positive returns.
Scenario 2: Global Recession Recognized
If this scenario manifests, it may happen before the Fed realizes what is going on. It would likely cause a deeper correction before Fed easing resumes. It is also possible the market may no longer have faith in the Fed. This could result in a deep correction in spite of Fed resumption of easing. We believe in this scenario our Less Volatile managers will hold up relatively very well and our Volatility Control managers will experience positive returns.
Scenario 3: Economic Growth Upturn
In this scenario the taper is likely to be implemented more quickly causing stocks to resume trading on fundamentals. Ironically it is in this scenario that ECRI will also signal an economic upturn. We will not be comfortable making a wholesale allocation change to higher risk, unless we see asset prices correct, US fundamentals do not warrant current prices. However, we will seek to opportunistically increase risk in areas of relative opportunities, in order to hedge against increasing inflation.
Asset Allocation Update
We continue to believe the US economy is in a recessionary state. Risk Tolerant clients own about 50% Long-Term, Less Volatile (LV) and 50% Volatility Control (VC) managers while Risk Averse clients own about 25% LV and 75% VC. The intention of the Volatility Control managers is to make positive returns in any economic environment; however, they have also suffered some short-term volatility (while typically less than similar bond funds) due the Fed announcement to end its stimulus. Ironically, the Risk Averse portfolios suffered the most during portfolio volatility because one of the LV managers (Pimco All Asset All Authority) in this portfolio experienced a drawdown similar to 2008 after making 17% in 2011.
LV managers also suffered somewhat, but typically much less than the overall market when it corrected. We believe, based on their current investment exposure that these in aggregate will be at least 1/3 less risky than the overall US market.
The Investor’s Dilema
The recent period of a rising stock market divorced from fundamentals is not without precedent. There have been numerous times in the history when this happened. The most dramatic and recent period occurred from 1999 to 2003 in the Nasdaq Bubble when the Fed provided a stimulus for Y2K, as discussed in a February Blog.
 When the punch bowl was taken from the party a nasty hangover ensued. Famed value investor Jean-Marie Eveillard, who suffered temporary underperformance (on paper) in 1998 making only 0.3% while the S&P 500 made 19.8%, lost half of his clients as the stock market soared. His famous response was “I would rather lose half of my shareholders than half of my shareholders’ wealth.” In the subsequent period when the S&P 500 experienced negative returns of -9.1%, -11.9%, and -22.0% during 2000-2002 calendar year period, First Eagle Global made 10.0%, 10.5% and 10.5%.
Click here to read the complete Blog.
The chart below illustrates how patient investors in First Eagle were rewarded with an example investment of $10,000 at the beginning of 1998 held through the end of 2002. First they experienced the regret of underperformance. Then those who fired Jean Marie to invest in the bubble faced even more regret. For investors who remained invested to the full period, the initial investment grew slowly in the beginning, First Eagle (in blue), but ended up 60% by the end of 2002. On the other hand, the ultra-fast growing Nasdaq (in orange) grew 300% before plummeting and ending down over 15%. Similarly, the S&P 500 (in green) also rose and dropped, ending down about 3%.

Next Steps
We remain vigilant and hopeful that we will see a durable expansion in world economic growth at some point soon. However, the data we monitor continues to show slowing or recessionary growth prospects despite some signs of a turnaround in employment. It now is apparent that the Fed and other central banks will not continue monetary stimulus forever. We believe it is only a matter of time before stock prices reflect weaker fundamentals and correct regardless of economic growth. We ask for your continued patience while we continue to do our best to preserve your capital in the hopes of making you better returns when opportunities arise. We will continue to keep you apprised as events unfold.

Written by Ken Moore
Ken’s focus is on investment strategy, research and analysis as well as financial planning strategy. Ken plays the lead role of our team identifying investments that fit the philosophy of the Global View approach. He is a strict adherent to Margin of Safety investment principles and has a strong belief in the power of business cycles. On a personal note, Ken was born in 1964 in Lexington Virginia, has been married since 1991. Immediately before locating to Greenville in 1997, Ken lived in New York City.
Popular posts
-
 How to Calculate Your Break-Even Age June 21, 2021
 -
 2025 Year-End Tax Planning Checklist November 21, 2025
 -
.jpg) Roth Conversions: When They Make Sense and What You Should Consider January 07, 2026
Roth Conversions: When They Make Sense and What You Should Consider January 07, 2026 -
 One Big Beautiful Bill Act: Key Tax Changes You Should Know November 26, 2025