Global View Investment Blog
Quarterly Newsletter to the Public - Q3 2013
Quarterly Newsletter to the Public - Q3 2013
“The greatest enemy of knowledge is not ignorance, it is the illusion of knowledge.”
Stephen Hawking
Executive Summary
The US stock and bond markets continue to trade based more on expectations of what the Federal Reserve will do than on fundamentals.
- The US continues to be in a long-term debt cycle contraction known as a deleveraging.
- Negative effects of this deleveraging can be mitigated if incomes grow faster than the cost of government debt.
- A Fed decision to taper before economic growth is sustainable, or a negative shock to the growth in incomes could derail the “beautiful” deleveraging.
- Historically, deleveraging periods can last 10-20 years, and stock markets typically trade sideways during these periods.
- Markets rarely trade sideways for significant periods without heavy volatility.
- This volatility can cause substantial permanent loss of capital if risk is not properly managed.
Putting the “Taper” in Context
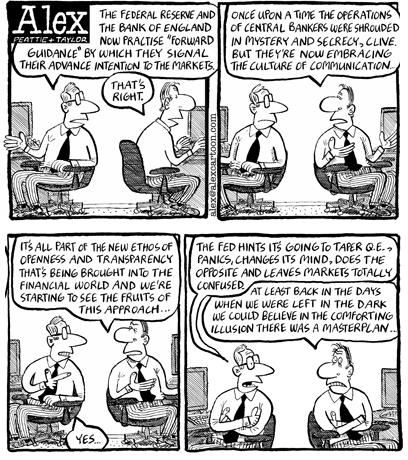
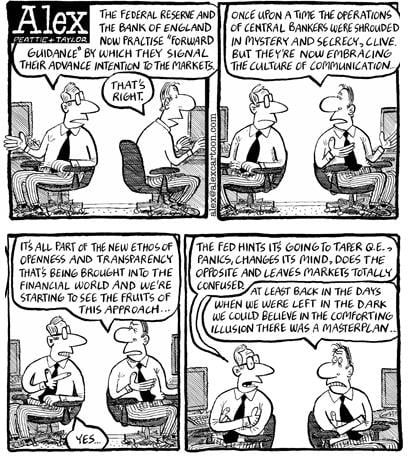
In our last newsletter we laid out a convincing case that stock market returns have been more a function of easy monetary policy than fundamentals. This was underscored once again when the Federal Reserve decided to delay its “taper” until a later date. The Fed delayed reducing the rate at which it purchases bonds in its open market operations in September. This caused an immediate rally in treasury bonds. This decision means the Fed now understands that US economic growth is at best, tepid. Therefore at the moment we remain in the Scenario 1 we highlighted last quarter; except that the taper has been delayed, probably until next year after the new Federal Reserve Chairman, Janet Yellen takes over. However, the taper is inevitable and is likely to cause increased volatility in stock and bond markets.
Economic Outlook – Continued “Beautiful” Deleveraging
Economic growth in the US has been trending down for some time. Instead of return to a 3.5% real GDP growth path, which so many sell-side brokerage firms suggest is “just around the corner,” economist David Rosenberg and Pimco’s El Erian suggest the new real GDP path is probably closer to 2%, at least until the total credit market debt is substantially reduced or “de-levered.”
Slow growth will persist until total credit market debt is reduced to a substantially lower percentage of GDP. Ray Dalio, of Bridgewater Associates, defined this period where a credit bubble is diminished rather than popped as “beautiful deleveraging.” A “beautiful deleveraging” can only occur when natural deflationary forces are assuaged. A key component to managing a “beautiful” deleveraging is to make sure income rises faster than debt. Since income can rise with either rising credit or rising money, easy monetary policy is essential to assure rising income in the absence of rising credit. In a nutshell, central banks deflate a credit bubble instead of allowing it to burst by filling the deflationary hole created by falling credit with new money.
According to Dalio the deleveraging in the United States remains on track as consumer and corporate sector debt has been shifted to the government. At the same time the Total Credit Market Debt to GDP ratio has fallen. Historically this process has taken 10 to 20 years and will depend on the mix of debt restructuring, austerity, wealth redistribution and debt monetization. Based on the rate of deleveraging thus far, this process could easily continue for another 15 years. For the “beautiful” deleveraging to be sustained nominal GDP has to rise faster than the cost of debt (loosely the rate of the 10 year Treasury bond). Therefore, the Fed should be wary of allowing interest rates to rise too abruptly, as this could put the “beautiful” deleveraging in jeopardy. This was a real concern when the Fed announced its intent to taper bond purchases earlier this year. This announcement briefly caused the ten year treasury yield to reach 3%, roughly the rate at which nominal GDP is growing. However, at the last Federal Open Market Committee meeting, the Fed decided to delay the taper until a later date.
It remains to be seen whether the earnings recession of 2012, where year on year earnings declined in Q3 and Q4, will be later declared to have been an official recession by NBER but there is no doubt that this has been a period of especially lackluster economic growth. Perhaps the most important metric for US households is the real median household income number, which has continued to fall throughout this recovery.
ECRI continues to believe the US economy is in recession. The long awaited economic pickup has not materialized. In fact economic data has deteriorated to such an extent that the announced “taper” by the Federal Reserve was delayed.
While there has been an economic growth upturn in peripheral Europe and Japan, much of the rest of the world remains mired in very slow growth or recessionary territory. It is hard to find a historical parallel where markets have rallied this strongly without corresponding growth in economic and earnings fundamentals. Bill Gross at Pimco remarked in his latest letter that a combination of the low economic growth that we are currently experiencing combined with higher interest rates could derail the beautiful deleveraging.
The two historical precedents we have of a “beautiful” deleveraging are the period from 1932-1937 in the US and the period following WWII in the United Kingdom. The beautiful deleveraging in the United States was derailed following two key actions that are highly analogous to the current period. First the Wagner Act of 1936 gave organized labor increased bargaining power, effectively increasing the cost of labor. Then, in 1937, the Fed raised interest rates. Today, The Affordable Care act is analogous in that it increases the cost of labor to such an extent that companies are reducing the number of full time employees to replace these positions with part time ones. Moreover the Fed’s announcement of its intent to “taper” purchases has already demonstrated the profound impact on interest rates such actions might have.
The Impact of Losses on Wealth
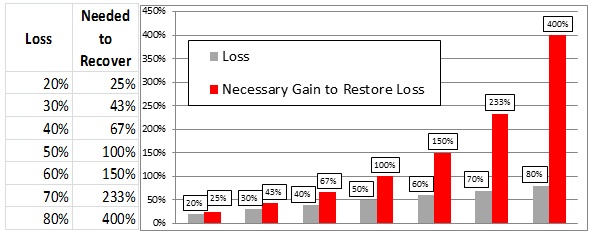
It remains to be seen what effect this will have on risk asset prices this time, but in 1937 the US stock market corrected 50%. Stock market forecasters who look at market history now forecast that US stock market returns will not be much more than 4% p.a. for the next decade. Since stocks rarely trade sideways over long periods of time without sizeable volatility it is likely that a sizeable correction will occur in the not so distance future. To put the kinds of losses market participants can experience into perspective and to help clients internalize it, the following table and chart illustrate the required return needed to recover from a given loss.
This is a key reason we seek to control volatility in our client portfolios. We know this can sometimes be met with relative regret and continue to believe the regret will be short-lived, i.e. a market correction will negate this regret. This is not a hunch or based on technical analysis but instead on fundamental valuations and is the shared opinion of the best money managers on the planet. When market indexes experience losses like above we expect our portfolios to be much more resilient.
Next Steps
We continue to look for the long sought after durable economic expansion which must come at some point. However with political uncertainty high and US economic growth still in the doldrums we do not feel it is warranted to increase risk until price is improved and the economic outlook is more agreeable. When warranted we will increase risk appropriately. We are excited about some of our investments but are exercising care in hopes to more aggressively allocate at better prices.

Written by Ken Moore
Ken’s focus is on investment strategy, research and analysis as well as financial planning strategy. Ken plays the lead role of our team identifying investments that fit the philosophy of the Global View approach. He is a strict adherent to Margin of Safety investment principles and has a strong belief in the power of business cycles. On a personal note, Ken was born in 1964 in Lexington Virginia, has been married since 1991. Immediately before locating to Greenville in 1997, Ken lived in New York City.
Are you on track for the future you want?
Schedule a free, no-strings-attached portfolio review today.
Talk With Us


