

“People are asking me where the outlook is good, but that’s the wrong question… The right question is: Where is the outlook the most miserable.'”
Legendary global investor John Templeton
Executive Summary
At the Morningstar conference in Chicago in June, some of the industry’s best and brightest were out sharing their thoughts on economic and market outlook, new opportunities for investing, management practices, and more.
- Bill Gross at Pimco unveiled his “new neutral” where economic growth, interest rates, and returns are likely to be low in a continued period of low volatility. This thesis ties well with Ray Dalio’s beautiful deleveraging thesis.
- Central bank actions may be somewhat supportive to stocks for a while despite high valuations. This may make a nasty recession less likely in the near term but cannot prevent volatility from recurring at some point.
- Many investors are frustrated with recent returns and want to increase their allocation to risk assets. While this in itself is not a good reason, investors’ asset allocations need to be made according to their true risk tolerance.
- We have finally discovered a way to measure risk tolerance that we believe does not vary based on recent market performance and sentiment. This is a great way to start a new conversation about the amount of risk you take in your portfolio.
The “New Neutral” – A Low Return World and Possibly Sideways Market
At the annual Morningstar conference in Chicago in June, Bill Gross of Pimco reaffirmed a thesis Ray Dalio of Bridgewater espouses, that we have been sharing with you for several years. This thesis states that central banks around the world have been, and will continue, to keep rates low in order to facilitate a reduction in overall indebtedness. More specifically the US, Europe and Japan will do everything they can to keep government interest rates low and spur nominal GDP. Thus reducing government indebtedness in relation to GDP.
The insight here is that these efforts have caused negative real interest rates and have made stocks historically trade at higher valuations than when these efforts were absent. Specifically, in 1981 US stocks traded for a valuation (Price to Earnings ratio or P/E) of 6 or 7. Now, depending on the P/E metric, they trade from 18 or so (trailing year) to 25 or so (trailing ten years). But this has to be put into proper context. In 1981, the real Federal Funds rate (the rate the Fed lends overnight to banks) was 8%. Inflation was 12% so nominal rates were 20%! Today, the real rate is -1.25%. Bill Gross suggests Central bank actions, specifically targeting lower rates, is the fundamental reason stocks were valued where they were in 1981 and why they are valued where they are today. In short low real rates mean higher valuations and high real rates mean lower valuations. This is the primary reason stock prices have risen despite a weak economy. Continued low rates is a reason that they may remain elevated for an extended period.
We heard a similar story from Chuck deLardemelle at IVA funds. Joey and Ken were also fortunate to have two hours with Chuck at dinner, the overwhelming majority of which Chuck spoke about a “bifurcated market” where many stocks are overvalued, but many stocks are at fair value making it difficult to find undervalued companies. We also had the opportunity to meet with Ben Inker at GMO, who, when pressed, admitted that interest rate policy may be supportive to asset prices for some time and that he sees corporate margin mean reversion coming from wage inflation in a growing economy more than from any other source. While the future outlook for the broad stock market is dim, this seems to take some of the big downside risk off the table in the absence of a major policy error.
The question is what are central banks going to do going forward. Will they raise these rates? Specifically, what rate is the US Federal Reserve likely to target? Bill Gross suggests this is likely to be 0% going forward, so if inflation ends up being 2%, nominal fed funds could rise from 0.25% to 2% instead of the 4% many pundits think is in store. This continued low rate would likely be mildly supportive of existing stock prices but NOT enough to keep them going up. It would according to Gross’ thesis, however, be enough to keep them from dropping precipitously. Moreover, we would be better served to treat 2008 as an outlier. In 2008, only 5% of stocks made money. Since 1980 the average is over 60%. Since 1980 there were only two years when less than 27% of stocks made money, 1994 and 2002. So 2008 was 5 times as bad as those two years and is not likely to be repeated unless we have another financial crisis (which central banks will do anything to avoid).
We recently came across a new investment manager, Kopernik Global, managed by David Iben. David is a deep value investor, very skeptical of valuations in the US who has been critical of the Pimco thesis of the “New Normal” and the idea of “stable disequilibrium.” Iben manages the Kopernik Global Allcap Fund, a more volatile investment, committed to being at least 80% invested in equity securities at all times. Kopernik recently wrote a paper called Sovereign Shares, where they make the case that in spite of their disbelief of the ability of the Fed to create economic growth using monetary policy, they do believe the Fed (and other central banks) will succeed in creating inflation.
In the paper, Paul Brodsky of Kopernik, explains that a “determined government can always generate higher spending and hence positive inflation,” and that “we already have a very well-established roadmap and a very well-established inflation trend and yet the public does not seem to get it yet.” While he believes Fed actions have been ineffective in creating real economic growth, he acknowledges that the Fed will continue to keep rates low in order to attempt to facilitate higher nominal economic growth and basically inflate away the problem.
Brodsky and Kopernik suggest that valuations and returns are being judged without regard to the purchasing power of the currencies in which they are denominated. Remember this is a time when all monetary authorities must cheapen their currencies. They suggest that a prudent investor should own sustainable businesses that have not relied on leveraging their capital structures. Central banks will continue to attempt to inflate away the problem. In their view, substantial excess returns will be found in demand-inelastic global resources and production companies. Iben’s latest letter, published in June, lays out an investment thesis for owning energy companies, telecommunications companies, and materials, which are trading substantially below their mean valuations while avoiding broad financials and information technology companies.
Because of actions central banks have taken and are likely to continue taking, he tells us that investors should be equally concerned with loss of purchasing power as with loss of capital.
Iben makes the very interesting case that investing in Russia (and emerging markets overall) is analogous to investing in Japan in the 1960s. This is an excellent analogy, because stocks in Japan in the mid-60s were trading for a price to earnings ratio of 4 while the US was trading at 19.5. Today, Russian stocks trade at levels similar to those experience in Japan in the 60s, while the US trades at a P/E ratio above 20.
We have no way of knowing the future. A deflationary event could occur at any time, but fundamentals suggest investors should think outside of the box, look abroad for opportunities and take action to avoid losing money that they can’t get back by:
- Avoiding the permanent loss of capital: owning the right securities in the right industries in the right countries.
- Avoiding the permanent loss of purchasing power: avoiding a strategic (long-term) allocation to a depreciating currency in cash. This may not mean immediately taking additional risk but does mean putting together a plan to do so.
Moving Forward – Renewed Effort to Understand Our Client’s Needs and Desire for Risk
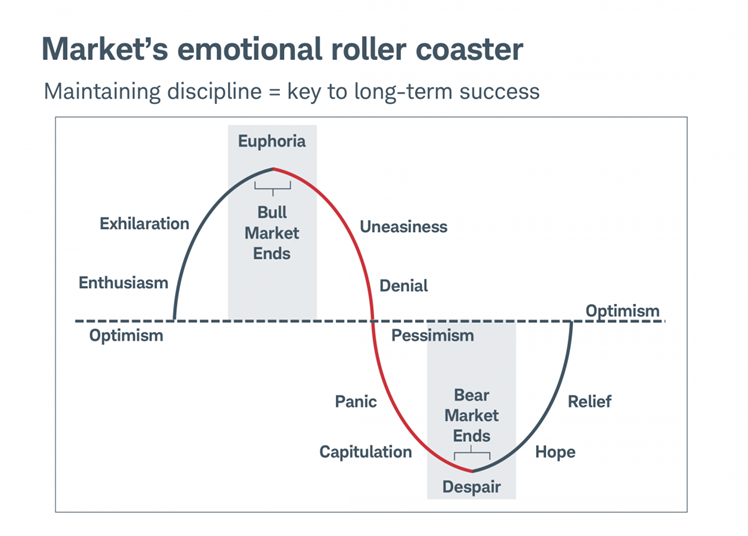
As you know, we have always been highly skeptical of risk tolerance questionnaires. We have always felt that determining investment strategy should be predicated on an in-depth understanding of our clients and that most of the time risk tolerance questionnaires add little value. However, at the Morningstar conference, we learned that some organizations have made a great leap forward in terms of “psychometric” testing to assess risk tolerance. These tests assess an investor’s true attitude toward risk instead of simply measuring one’s current willingness to take risk depending on their sentiment (which fluctuates depending on how stocks are doing). As the chart below illustrates, investors tend to be more willing to take on risk during bull markets and less willing to do so as markets plunge. This is why they lagged the S&P 500 by over 4% p.a. for the last 20 years according to a recent Dalbar study. In fact, this is a fundamental reason that advisors typically advise their clients to take less risk … they know that investors get scared, bail and subsequently lose money they can’t get back. We want to make sure that neither we, nor our clients are overwhelmed by this emotional roller coaster. As always, our first goal is to help clients avoid making decisions that will cause them to lose money that they can’t get back.

At the same time, it is equally important that we align our client’s investment strategies to their true long-term goals. Inflation can also cause investors to lose money that they can’t get back just like having a big loss can. While inflation is currently subdued, the latest readings in the US were the highest in six years. In any case we need to be mindful that there will be inflation over the long run and that ignoring this reality can also result in permanent loss of purchasing power.
We have always tried our best to determine our clients’ risk tolerance by showing them their minimum acceptable return target, learning how they reacted to risky situations as they occurred in 2000-2002 and 2007-2009, and learning more about their background. We have even given some clients rudimentary questionnaires which we felt to be of low utility. However, now we have a tool that we believe does a pretty good job of estimating a client’s true risk tolerance. The tool is administered by FinaMetrica, a company that has been assessing risk for institutional clients since 1994. This system is based in Australia and is used in 20 countries. It was launched in 1998 and has a database of over 600,000 risk profiles. FinaMetrica, like most companies we admire, is privately owned and completely independent and unbiased.
The FinaMetrica process is better because it uses psychometrics, a combination of psychology and statistics. Using this process a client’s risk tolerance will remain relatively stable and will not change with market conditions; however, a client’s risk tolerance may change with his or her fundamental conditions change, i.e. death of a family member, retirement, disablement, losing a job, etc. and may need to be re-administered.
Unlike other risk tolerance examinations, which fluctuate widely over time, FinaMetrica is remarkably stable. Perhaps the most convincing testament to the durability of this score was a test/retest study carried out by researchers at the University of Western Australia, the University of Queensland and the University of Newcastle. In this study, the same individuals had been tested in the 2003-07 bull market and then retested in the 2008-09 bear market. The average score decreased only 1.9, less than one fifth of a standard deviation.The chart below shows the average risk tolerance scores compared to the world stock index over a 15 year period.

What this all means for investors is that risk tolerance is one of the few aspects of their life that is unlikely to change over time. This makes it a solid foundation for conversations about risk generally. While we will not be governed by this and may choose to “moderate” our risk tolerance, generally most investors prefer to stay somewhere close to their risk tolerance “range.” Specifically, your risk tolerance score generally coincides with the percentage of “risk” assets you should own in a portfolio. There is a comfort zone of +/-10% where most investors are comfortable (green zone) and +/-11-20% (yellow zone) where risk is tolerable but becoming uncomfortable. Anything above or below 20% out of bounds tends to be intolerable (red zone).

“Risk tolerance” cannot be confused with “loss tolerance.” How somebody feels about taking risk is not the same as how they respond to the loss. Nonetheless, having a scientifically derived systematic process for arriving at a strategy for risk budgeting is likely to help you avoid making a mistake that will result in losing money that you can’t make back (avoiding the risk of permanent loss of capital). This has been and will always remain, our first imperative!
We will be asking many of our clients to complete this FinaMetrica risk tolerance assessment, especially clients who believe they should be taking more or less risk than they have historically. It is not uncommon for a person or for an advisor to grossly misjudge an investor’s risk tolerance. It is also extremely common for married couples to have widely differing risk tolerances.
This assessment will not be a panacea, but is instead a great place to start a new conversation on taking risk in this “new neutral.”
Thank you again. We hope you find this useful and look forward to discussing it with you soon.

Written by Ken Moore
Ken’s focus is on investment strategy, research and analysis as well as financial planning strategy. Ken plays the lead role of our team identifying investments that fit the philosophy of the Global View approach. He is a strict adherent to Margin of Safety investment principles and has a strong belief in the power of business cycles. On a personal note, Ken was born in 1964 in Lexington Virginia, has been married since 1991. Immediately before locating to Greenville in 1997, Ken lived in New York City.
Popular posts
-
 How to Calculate Your Break-Even Age June 21, 2021
 -
 2025 Year-End Tax Planning Checklist November 21, 2025
 -
.jpg) Roth Conversions: When They Make Sense and What You Should Consider January 07, 2026
Roth Conversions: When They Make Sense and What You Should Consider January 07, 2026 -
 One Big Beautiful Bill Act: Key Tax Changes You Should Know November 26, 2025