

Quarterly Newsletter to the Public Q4 2014
January 30, 2015
“The More I Sweat in Peace, the Less I bleed in War.”
Norman Schwartzkopf (re-quoted from Vijaya Lakshmi Pandit, Indian Diplomat)
Executive Summary
In order to avoid fatal mistakes, prolonged periods of patience may be required, i.e. we have to sweat in peace to avoid bleeding in war. While the cheapest parts of the world have been the lowest returning in the short run, history shows that long run returns for international and US markets are nearly identical.
- Of major markets, only the United States experienced positive returns in 2014. This outperformance is substantial on a 1, 3 and 5 year basis.
- Excellent managers with nearly unrivaled long-term track records experienced low returns in 2014 because they are focusing on the more undervalued areas of world markets.
- Valuations and global Central Bank actions support higher exposure to overseas developed and emerging markets and only careful exposure to the United States markets.
2014 – Negative Returns for Most of the World
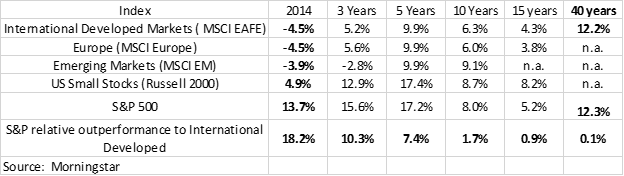
2014 was a year where most markets outside of the US suffered negative performance. Below are return numbers for some major indexes in US Dollars for 2014 and for the last 3, 5, 10, 15 and 40 years.

US markets have substantially beaten international developed markets over the last 1, 3 and 5 years but that relative performance substantially falls for 10 and 15 years and fades to nearly zero on a 40 year basis.
It is important for investors to remember that we have two periods in the last 15 years where investors could have lost half or more of their investment and had to wait at least 5 years to recover. These periods all coincide with times when markets had high valuations. Strategies avoiding the trouble spots, with high valuations, weathered these storms particularly well, as we pointed out in our last newsletter.
Most investors chase returns when they have been good and flee when things look tough. This has caused them to lose about 4% per year for the last 20 years relative to the performance of the overall market. We want to make sure that our clients and their friends and families, avoid these predictable mistakes.
Update on the Smartest Investors with the Best Long Term Track Records
Tony Robbins, a motivational speaker and advisor to some very successful people, recently wrote a book called Money, Master the Game. The goal of this book was to identify a “simple and proven path to financial freedom.” In order to discover this he interviewed 12 successful money managers and made an attempt to implement the all-weather portfolio of Ray Dalio, of Bridgewater Associates. While we do not agree with Tony’s rationale for investing, which includes having a permanent allocation of 40% to long-term treasury bonds that is rebalanced annually, we do respect the council of Ray Dalio who has an excellent long-term track record audited since 1991.
Ray Dalio was the first prominent investor to put forth the idea of a “beautiful” deleveraging, i.e. a period where excess debt could be slowly eradicated as the economy grows faster than debt. While debt remains high, his thesis is playing out. Total Credit Market Debt (company, personal, and government) reached a peak of nearly 4 times the economy and has slowly fallen as the economy has recovered since 2009. As of the end of September 2013, the ratio of Total Credit Market Debt to GDP is about 3.3. This happened in conjunction with the US Federal Reserve printing over $3 trillion through its multiple quantitative easing (QE) programs.
To put this in numbers, the S&P 500 has returned about 18% p.a. for the last 3 years while Dalio’s funds targeting 12% and 18% volatility respectively returned 2.2% and 3.2%. However looking back to 1992, Dalio’s funds have returned 9.5% and 13.2% while the S&P 500 returned 9.3%. This was accomplished with substantially less risk. Dalio, seeing problems in 2007, was conservatively positioned and actually experienced positive returns when the major markets were down over 50% from 2007-2009.
Managers we love with investment track records of 20-30 years or more, like Dalio, generally suffered underperformance compared to the US stock market in 2014. Those more exposed overseas suffered the worst, a couple actually were negative for 2014. We know based on historical analysis that this underperformance is rare, and happens most often in times when our managers are unwilling to participate in overvalued markets.
Valuation Backdrop
The United States ended its QE program last year but other Central Banks have not. The Bank of Japan is committed to a program to increase its balance sheet by about $700 million a year and the European Central Bank recently committed to about $1.3 trillion over the next two years. Many investment pundits believe this will be supportive of international stock prices due to the high correlation of QE in the US and stock price movement. We cannot know how this may affect stock prices and will not speculate. However, we can look at valuations and make some assumptions that markets will continue to work as they have in the past.
Based on conservative, long-run valuation metrics, the US market is overvalued. International developed and emerging markets are about fair value based on market capitalization weightings but cheap based on fundamental weightings. Typical indexes used by most mutual fund companies and Exchange Traded Funds are constructed using a market capitalization weighting. The problem with this process is that it gives a greater weighting to the most expensive stocks and a lesser weighting to cheaper stocks. This seems unambiguously backwards.
Fundamental indexes buy on fundamental metrics such as sales, cash flow and dividends, instead of buying on an arbitrary metric, like how large the company is. This is similar to what margin of safety active managers do.
At this point market capitalization indexes like the US S&P 500, trade at 10 year (Shiller) Price to Earnings ratios of over 26, and are set to return less than 1% p.a. for the next 5 years assuming valuations start to slowly mean revert to long-term averages. International developed (EAFE – Europe Asia and Far East) and emerging markets appear much more attractive.
The graphic below has two pieces of information. The chart in the upper left hand corner shows the current valuation of US, International Developed (EAFE) and Emerging Markets (EM) in both market capitalization weighted and fundamentally weighted terms. The vertical lines in the chart show the expected valuation range in poor economic environments (the red bar) and good economic environment (the green bar) based on what has happened in history.
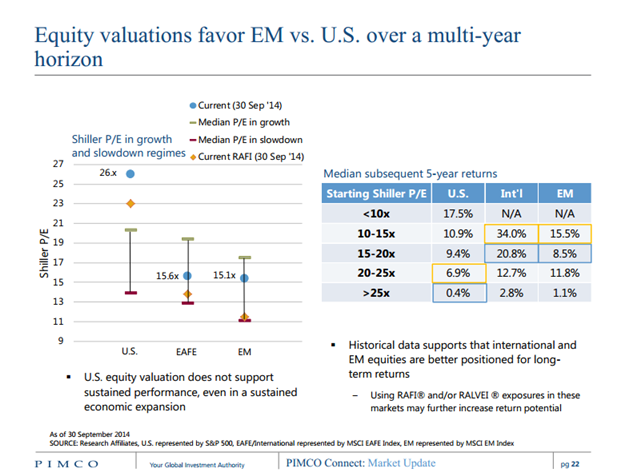
The table to the right shows the expected median 5 year annual returns based on starting valuation ranges. The boxes in blue show the expected return based on making a purchase in a market capitalization weighted index. This shows US returns to be nearly zero, but returns overseas to be much higher. The boxes in yellow show the expected return making a “smart” purchase in a fundamentally weighted index. These returns are substantially higher and make a compelling case to consider fundamentally weighted or actively managed investments in overseas Developed and Emerging markets.
At this time, the US is expensive and overseas developed and international markets are relatively cheap. We feel this information calls for continues focus on global opportunities and cautious exposure to US markets.
How Can We Use This Information
We believe markets are inefficient in the short run and that eventually investors figure out the intrinsic value of companies. This creates valuation disparities that create the opportunities active management needs in order to work. We love the United States and are not avoiding investing there. However, we believe you have to be especially careful – market capitalization index investing in the US is likely to be a loser’s proposition over the next 5 years. While reasonable return prospects exist for some US companies with sound fundamentals long-term prospects are much higher overseas. It is overwhelmingly compelling to have a truly global perspective.
We have several vehicles we can use to take advantage of this including our active managers, fundamentally weighted index-based strategies, and our stock portfolios derived from Morningstar research and fundamental quantitative analysis.
We know that fundamentally-based strategies may sometimes require extended periods of patience, but history has shown this process gives us the best odds of helping our clients achieve their unique goals. Our objective is to make sure every client has the right portfolio based on his or her specific needs including time horizon, tolerance for taking risk, and capacity for taking risk. Our efforts to beef up our team and offer truly comprehensive tax and estate planning are working and we look forward to working with you, your children, and your grandchildren, for many years. We are grateful for your patronage and will to strive to provide the highest level of service possible to all of our clients.
Please reach out to us any time for further clarification on any financial planning issues you face or to discuss the investment opportunity set and our positioning in more detail.

Written by Ken Moore
Ken’s focus is on investment strategy, research and analysis as well as financial planning strategy. Ken plays the lead role of our team identifying investments that fit the philosophy of the Global View approach. He is a strict adherent to Margin of Safety investment principles and has a strong belief in the power of business cycles. On a personal note, Ken was born in 1964 in Lexington Virginia, has been married since 1991. Immediately before locating to Greenville in 1997, Ken lived in New York City.
Popular posts
-
 How to Calculate Your Break-Even Age June 21, 2021
 -
 2025 Year-End Tax Planning Checklist November 21, 2025
 -
.jpg) Roth Conversions: When They Make Sense and What You Should Consider January 07, 2026
Roth Conversions: When They Make Sense and What You Should Consider January 07, 2026 -
 One Big Beautiful Bill Act: Key Tax Changes You Should Know November 26, 2025