


The Holy Grail is Imaginary
The ideal investment is one that pays its return as steady income every month, every quarter, every year. High-fee hedge funders lost clients a lot of money in pursuit of this impossible Holy Grail, because it is imaginary.
Insurance companies peddle false promises to clients offering “guaranteed income” with so many strings attached that the “guarantee” is just a return of principle.
The Holy Grail investment is imaginary. But math is not.
Math is Real
Most science is whatever scientists say it is. The sciences of psychology, nutrition, biology and many others have little resemblance today to the same sciences a hundred years ago.
But math is real. The best teacher in history is Richard Feynman. Richard was a Theoretical Nuclear Physicist whose no-nonsense approach literally saved the Oppenheimer project. Physics is the study of the physical world. The physical world is something you can see, touch, smell, and hear. It is not imaginary.
Math is the language used to express it.
In the world of investments, we use math to express fundamentals.
The price you pay for earnings, assets, or cash flow, expresses the value of a company when considered in context of a company’s quality and growth.
Quality companies enjoy high returns on equity and assets. Really high-quality companies have a “wide moat” protecting their profits from competitors so they can keep making high profits. Higher quality companies are worth more.
Growth is how fast a company grows it earnings and sales. Great businesses steadily grow earnings and sales. Higher growing companies are worth more.
Cheap, high quality companies with good growth characteristics rarely fall in price. And when they do, they bounce back (usually quickly).
Using these mathematical fundamentals has worked well for people like Warren Buffett (and the other super investors of Graham and Doddsville), Peter Lynch (before his fund got too big), and Jean Marie Eveillard (who is unfortunately now retired from portfolio management).
The problem with most indexes (and most closet-index funds in company 401ks) is that they also contain many bad companies with bad value, quality, and growth ratios. You shouldn’t be surprised when they fall a lot, when things get tough.
From March 25, 2000 to October 12, 2002, US large stocks fell 48%, recovering in late 2006 before subsequently falling again in 2007.
From October 13, 2007 to March 9, 2009, stocks fell 55% taking until late 2012 to recover.
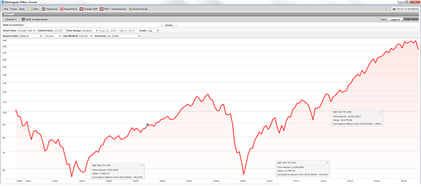
The rubber band broke, like a cheap one left out in the sun too long.
Given the recent run in stocks, it might be time for you to ask how this math can help your portfolio. Right now, the math favors assets your advisor is probably not talking about.
And if the rubber band snaps this time, it could mean you can’t retire. Or it just might mean you don’t have any money to leave to grandkids.


Written by Ken Moore
Ken’s focus is on investment strategy, research and analysis as well as financial planning strategy. Ken plays the lead role of our team identifying investments that fit the philosophy of the Global View approach. He is a strict adherent to Margin of Safety investment principles and has a strong belief in the power of business cycles. On a personal note, Ken was born in 1964 in Lexington Virginia, has been married since 1991. Immediately before locating to Greenville in 1997, Ken lived in New York City.
Popular posts
-
 How to Calculate Your Break-Even Age June 21, 2021
 -
 2025 Year-End Tax Planning Checklist November 21, 2025
 -
.jpg) Roth Conversions: When They Make Sense and What You Should Consider January 07, 2026
Roth Conversions: When They Make Sense and What You Should Consider January 07, 2026 -
 One Big Beautiful Bill Act: Key Tax Changes You Should Know November 26, 2025