


Quarterly Newsletter Q1 2015
April 28, 2015
“In Math, we can sort of know that we’re wrong. We can even sometimes know that we’re right … The main thing is where you set the bar between success and failure. Some people will say 99 percent correct is failure because you made a mistake.”
Donald Knuth, author of The Art of Computer Programming
Executive Summary
Human beings are their own worst enemy when it comes to investing. We believe we can substantially improve our clients’ odds of meeting their goals through a disciplined process of assessing their true risk tolerance, coaching to expected short-term volatility, and managing for long-term performance based on fundamentals.
- Not only are investors irrational, they are predictably irrational. 92% of investors will take irrational risk to avoid a loss and only 20% of those same investors will take a rational risk to make a gain.
- If we can gain an accurate assessment of an investor’s risk, we can coach to expected volatility over a reasonable short-term time horizon of six months and help them to stay on course over the long-term.
- Extensive research by the Margin of Safety investing pioneers and those following their lead indicates that odds can be substantially improved over reasonable time horizons of 3-5 years. We do this by focusing on fundamentals like valuation, quality, and earnings sustainability and a choosing to make rational choices.
- A truly global approach is always warranted. The current investment opportunity set strongly favors overweighting international developed and emerging markets versus market capitalization weighted US. In the US it seems highly prudent to look for strong fundamentals in relation to valuation and a moat for earnings sustainability. This doesn’t mean we should avoid the US, just avoid the most troublesome spots of it.
Short-Term Risk and the Investor Experience
The work of 2002 Nobel Prize winner Daniel Kahneman teaches us that not only are we, as human beings, irrational, but that we are predictably irrational. We like to take our clients through a game that illustrates this. This game takes place over a period of two days. On the first day, the participant is forced to make a “gamble,” choosing to minimize his loss:
- Gamble A: A guaranteed loss of $3,000
- Gamble B: A 20% chance of losing nothing and an 80% chance of losing $4,000.
On the second day, the “gamble” is a choice to maximize a gain:
- Gamble C: A guaranteed gain of $3,000.
- Gamble D: An 80% chance of winning $4,000 and a 20% chance of winning nothing.
If the participants used their rational brain, or what Daniel Kahnemann calls System 2, they would calculate the expected value of each choice. On the first day, the highest expected value is Gamble A, which has an expected value of -$3,000, more than Gamble B, which has an expected value of -$3,200. On the second day, the highest expected value is Gamble D, which has an expected value of $3,200, more than Gamble C, $3,000.
Participants are not only not perfectly rational, instead they almost always make the wrong choice, i.e. are nearly perfectly irrational. They use what Daniel Kahneman calls System 1, which is their fight or flight reflex. This reflex is perfect for getting away from a bear but not so useful in investing. In fact, on day one, 92% of participants make the wrong choice, while on day two only 20% of participants make the right choice.
When we show people this information a light switches on helping them see that they need to think before making important decisions. Kahneman calls this switching to system 2 (the forebrain or rational mind) instead of instinctually reverting to system 1 (the reactionary hindbrain). This presents us with an opportunity to educate people to take a rational longer view instead of allowing their fear to cause them to be short sighted. We cannot overestimate the importance of this insight. If we can help investors look at the odds, and make rational choices based on these odds, we can help them to make choices dictated by fundamentals, like valuation. This is in sharp contrast to how we know they typically act, which is essentially to make choices based on hope. We would be happy to take your through the exercise. If you want to research this phenomenon even further, we highly recommend Thinking Fast and Slow, by Daniel Kahneman.
With this information in mind, and knowing that over full market cycles returns are driven by fundamentals, we manage portfolios for the long-term by helping our clients avoid reacting inappropriately in the short-term. Many investors experience a great deal of discomfort when they see their investments fall over a short time horizon and may sell at just the wrong time converting short-term volatility into the permanent loss of capital.
Therefore, anything we can do to help investors manage for the long-term but be aware of their likely behavior over the short-term is invaluable. Our way of approaching this is to:
- Assess our clients’ true risk tolerance.
- Educate our clients on expected volatility over the short-term and coach them to expect this.
- Manage to the long-term by accurately understanding the investment opportunity set.
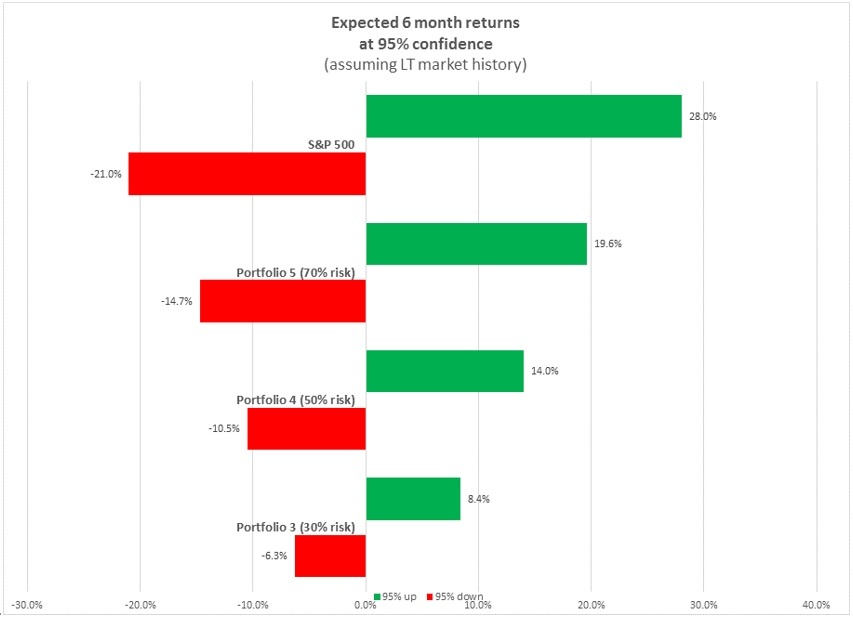 While we can’t manage for all situations, if we can set expectations for returns most of the time (say 95% of the time) then we can prepare our clients for what they might expect based on history. If we look at the range of 6 month returns in the US stock market since 2000, then we can set expectations for what an investor in it might expect over any 6 month period. The chart below shows the returns one might expect in the S&P 500, and 3 portfolios with a risk budget of about 2/3 of the S&P 500, ½ of the S&P 500, and 1/3 of the S&P 500.
In short, there is no shortcut to avoid short-term volatility. This tool allows us to coach our clients on the amount of volatility they might expect based on their risk budget. Clients who desire a higher return over time have to take more volatility over the short run. Our focus should not be to get rid of short-term volatility but instead to increase odds of winning over a longer time horizon of 3-4 years.
Reasonable Time Horizons to Expect Positive Returns
If investors could think in the long-term we wouldn’t see the results we see from the Daniel Kahnemann game. If we set expectations that the long-term is 3-5 years, we can coach for returns over this time horizon. In addition to the ulcers we discussed earlier, we can examine the history of investment strategies and the odds of falling within a return range over differing time horizons.
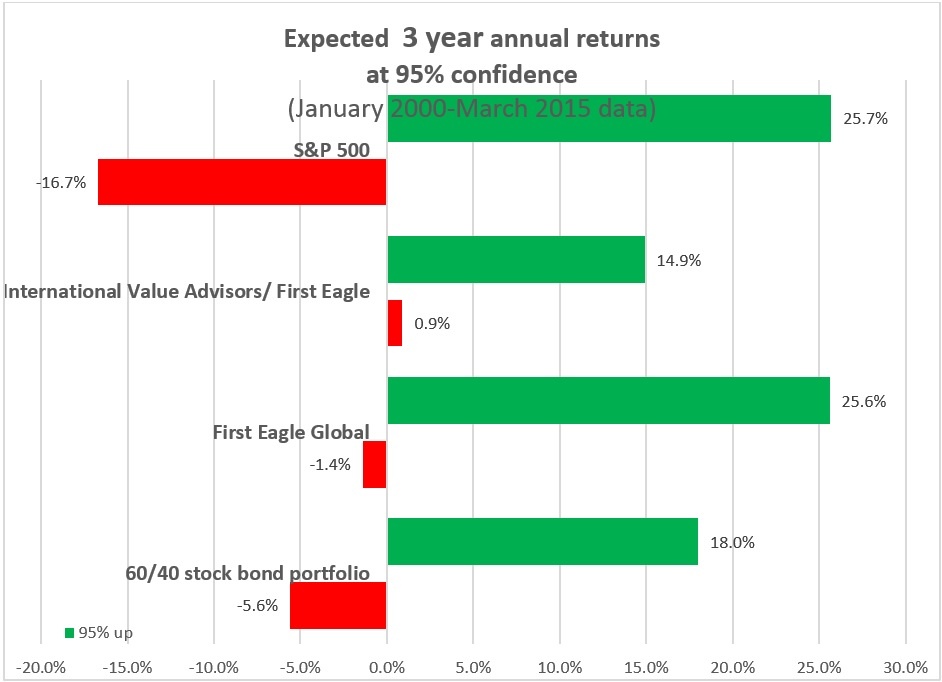
We looked at the return history and variation of returns of the US stock market back to January 2000 in order to get a feel for what might be expected at 95% confidence over a 3 year time horizon. You might expect the S&P 500 to be down cumulatively over 40% and the 60/40 portfolio to be down 26%. We compared these two confidence intervals with those of two investments incorporating the go anywhere Margin of Safety investment strategy.
We have run these analyses on the portfolios we offer including the stock strategies and can show them to you on request.
A Fundamental Approach to Long-Term Investing
When people talk about “the market,” they generally mean the S&P 500 market cap weighted index. Market cap weighting means that larger companies account for the greatest portion of the index. For example, the largest company in the market cap weighted index is Apple, comprising almost 4% of the index. If we weighted Apple by its fundamentals such as average dividends, free cash flow, and sales, as Research Affiliates does in their US index, Apple would be ranked 16th. Apple is #1 ranked in the market cap index because it has grown its price by 30% p.a. over the last three years. If Apple cannot grow its fundamentals (sales, earnings, dividends) commensurate with its share price it will become overvalued.
IBM, another well-known company in the S&P 500 index comprises only 0.8% of the market capitalization weighted index and has grown its price only 6.5% p.a. for the last 5 years. IBM is owned by Berkshire Hathaway and in our Quality Growth Unconstrained and Margin of Safety stock portfolios.
It seems clear that a rational investor would avoid investing in the more overvalued companies in an index and seek to get bargains. In this context IBM appears to be a bargain versus Apple. Similarly, overseas markets appear to be more of a bargain than the US. Buying the US market capitalization index just doesn’t make any sense in this context. Investors should seek US market exposure in another way.
The Opportunity Set based on Valuation and Historical Risk
In our last newsletter, we showed the expected returns of US, International Developed, and Emerging markets based on market cap weighted and fundamentally weighted index. Taking this data, and volatility metrics we found on the Research Affiliates website, we can use the same reasoning to build 95% confidence intervals for investing in the US and abroad. Again, the red graphic shows the possible annual loss over the next 5 years and the green the positive.
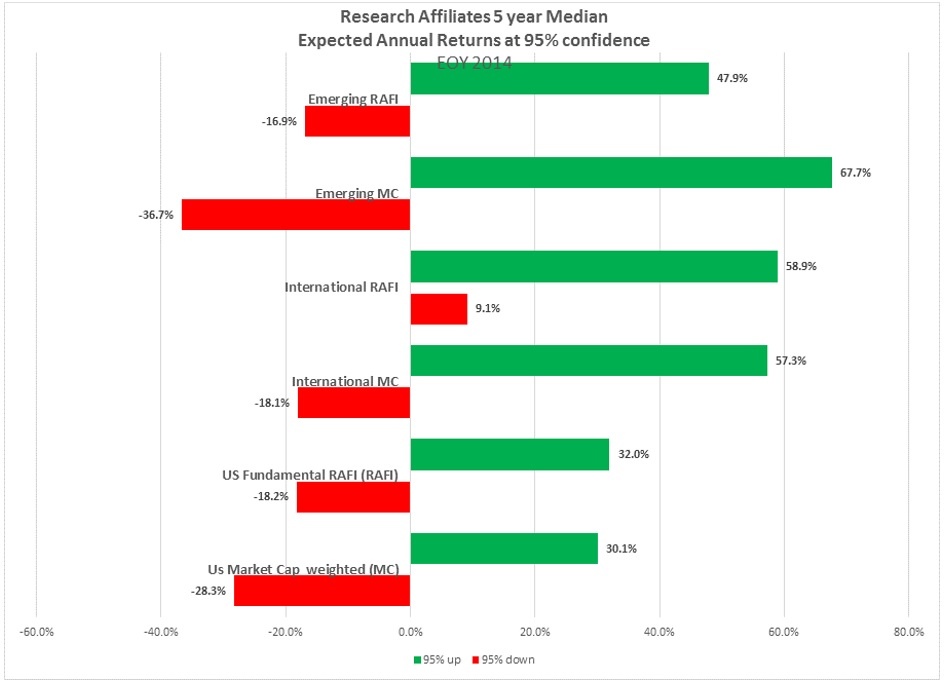
Based on the expected returns forecasted by Research Affiliates and our assumed standard deviations which we found on their website, the markets with the most favorable risk/return profiles for investing over the next five years are fundamentally weighted International developed markets (International RAFI) and fundamentally weighted Emerging markets (emerging RAFI). The least attractive place to invest, with the lowest upside is the US market capitalized weighted index which currently represents over 58% of the world market capitalization. For much of the last 15 years the US market capitalized weighted index has represented under 30%. Moreover, the economy of the US represents only about 22% of the world economy. The last time a country had this much of a relative overweight was Japan in 1900.
Integrating this into our Investment Process
It is imperative that every investor have an accurate understanding of their risk tolerance that is valid and enduring. We believe the FinaMetrica psychometric test fits the bill because the average score at the market peak in 2007 was nearly the same as the average score at the market bottom in 2009. After we complete the process of evaluating a client’s risk with FinaMetrica and taking them through the financial planning process to determine their capacity for risk, we assign clients to a Risk Group which determines their risk budget
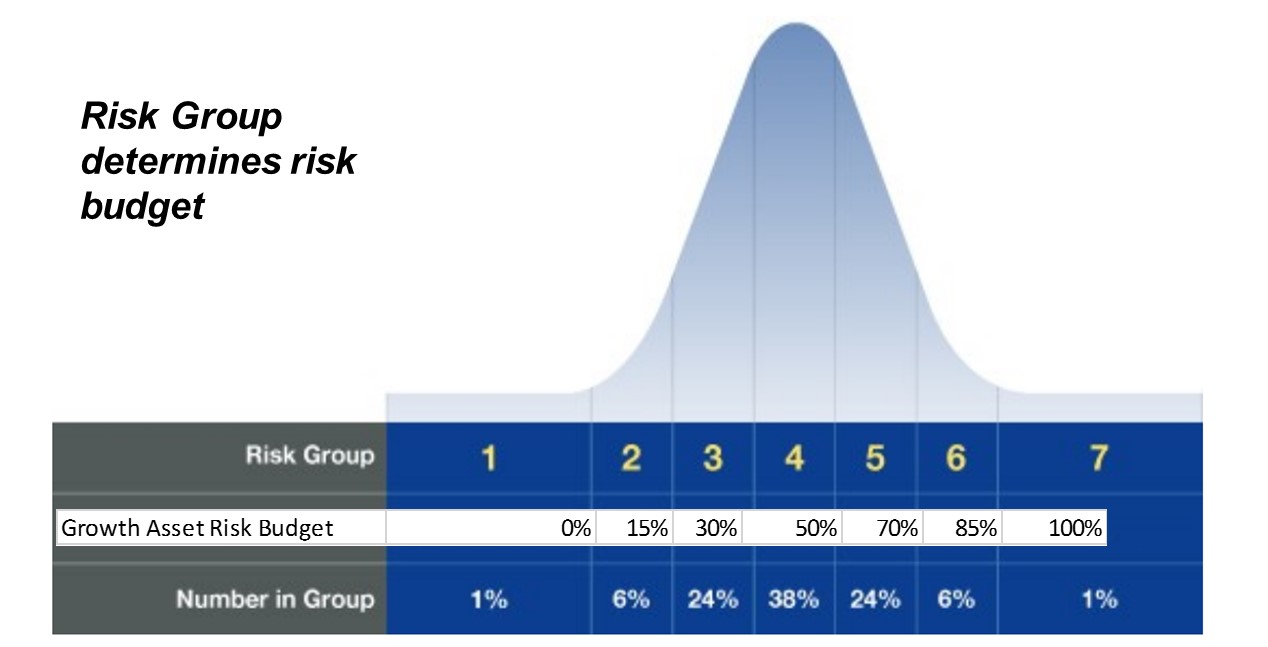
86% of all investors fall into Risk Groups 3, 4, and 5. For risk group 3, we expect to take about 1/3 of the market risk, for risk group 4, about ½, and for risk group 5, about 2/3.
In terms of allocating the risk budget, we feel it is imperative to go where the value is. Right now, there is more value outside of the US than in the US. In the US, you need to make sure that you own assets that have a strong competitive advantage (a MOAT) or that are very cheap. It is harder to find assets that are cheap when the market prices have risen this much, so we are increasingly focusing on quality and MOATs.
We have several vehicles we can use to take advantage of this including our active managers, fundamentally weighted index-based strategies complied by Research Affiliates, and our stock portfolios derived from Morningstar research and fundamental quantitative analysis. We believe this fundamental approach will lead to positive returns over reasonable time horizons and that over full market cycles we can beat relevant indexes.
Please reach out to us any time for further clarification on any financial planning issues you face or to discuss the investment opportunity set and our positioning in more detail.


Written by Ken Moore
Ken’s focus is on investment strategy, research and analysis as well as financial planning strategy. Ken plays the lead role of our team identifying investments that fit the philosophy of the Global View approach. He is a strict adherent to Margin of Safety investment principles and has a strong belief in the power of business cycles. On a personal note, Ken was born in 1964 in Lexington Virginia, has been married since 1991. Immediately before locating to Greenville in 1997, Ken lived in New York City.
Popular posts
-
 How to Calculate Your Break-Even Age June 21, 2021
 -
 2025 Year-End Tax Planning Checklist November 21, 2025
 -
.jpg) Roth Conversions: When They Make Sense and What You Should Consider January 07, 2026
Roth Conversions: When They Make Sense and What You Should Consider January 07, 2026 -
 One Big Beautiful Bill Act: Key Tax Changes You Should Know November 26, 2025