

Executive Summary
Investors wonder whether the US and Global Economies are heading into another recession and how this might impact their investments. We know that growth has slowed, but believe a deep double dip recession remains unlikely. The current slow growth environment is unlikely to feel like a recovery for many people especially as unemployment remains high.
In this environment, economic and stock market volatility are likely to continue adding to investors’ frustration. Index-based, buy and hold strategies, or bond-based income seeking strategies are likely to be disappointing over the next several years, particularly given investors disposition to sell at just the wrong time. Moreover, the specter of inflation, unlikely in the short-term, is a near certainty in the medium to long term and can devastate bond investors. Continued uncertainty during volatile times can cause investors to second guess their long-term strategy and opt for “easier” solutions, like reaching for yield in “risk-free” investments, chasing returns in gold, or trying to time the market by sitting on the sidelines “until things get better”. The Margin of Safety strategy has proven its ability to work in volatile markets. Our managers capitalize on volatility. They capture lower downside risk and much of the upside of market movements. This has been well demonstrated by our managers during the last crisis and by their kin during previous crises.
Looking more deeply into our manager’s strategies provides increased confidence that their efforts will continue to yield fruit. In a predictable, perfect market, they could not deliver risk-adjusted returns. It is by navigating volatile markets thru rigorous security selection that they have added value in the past. As we continue to conduct due diligence on them, we believe they are the best choice for the future.
Economic Update
Economic growth in the US slowed at the beginning of the year, after a sharp rebound beginning in June of last year. Most investors don’t even realize the sharp nature of the upturn, because unemployment has remained elevated, and because the media does better by selling pessimism than by selling optimism. We recently attended an Investment Forum with JP Morgan, featuring their leading experts. David Kelly, Chief Investment Strategist, used an analogy to show how truly out of proportion the media response can be. Clearly the BP oil spill was an environmental tragedy. However, David ran some math to illustrate the overall effect of the oil dumped into the Gulf. To cut to the chase, the overall volume of oil dumped into the Gulf is analogous to a teardrop in a swimming pool. Since the spill has been plugged, there has been little news coverage.
We make this point because the media and pundits tell us there has been no recovery or that a double dip is imminent. We are not experts on the economy, and we feel it is very difficult to predict a recession. That said, it appears more likely we will face slow growth for some period than experience a severe double dip recession. Leading economists we respect believe a double dip is likely only if a major policy error occurs, such as allowing the tax cuts to expire. Moreover, the most cyclical components of the economy, those generally responsible for recession and recovery, have hardly recovered. These are: automobile consumption, residential construction, equipment, and business inventories. The latest recession was led primarily by a drop in residential and commercial construction, but business investment including a reduction in inventories also dropped precipitously. To date, and this is consistent with consumer deleveraging, there has been only a very mild recovery in automobile consumption and residential construction. From these levels it is hard to imagine how they could drop further and put the overall economy into seriously negative territory. Following are some reasons that make it difficult to imagine how the economy could drop significantly from this level:
1. Business inventory to sales ratios remain very low, suggesting room for an increased build in inventories.
2. Automotive sales remain near an all-time low.
3. Housing build is running 1/3 of trend. Yes there is excess capacity, but it is slowly being absorbed by the increasing population.
The greatest risk to continued economic growth is a policy mistake or an exogenous shock. For example, should our government fail to extend the Bush tax cuts, this would put continued downward pressure on disposable income, and reduce consumption and investment. Alternatively, a geopolitical event could trigger a major spike in oil prices.
US consumers have responded to the crisis prudently. They have increased savings to almost 6% and are paying off debt. Nearly ¾ of consumer debt is in mortgages. The drop in interest rates has allowed consumers to refinance and reduce their payments, freeing up additional cash; anecdotally mortgage brokers tell us they see a lot of refinancing from 30 year mortgages to 15 year mortgages. Before the crisis (Q3 2007) 14% of disposal income was used to pay debt. Now it is down to about 12% (close to its long term average).
The experts at JP Morgan believe the following are catalysts for continued economic growth and reasons to be bullish:
• The tax cuts are likely to be extended (but only AFTER the election).
• The Federal Reserve, fearful of deflation, is likely to embark on another program of quantitative easing. Quantitative easing is the policy of the Federal Reserve Bank buying assets to add liquidity. This generally raises risky asset prices and will eventually lead to inflation but in the nearer term it has historically resulted in a rise in overall price levels.
• Increased merger and acquisition activity will continue to boost share prices.
We are skeptical of any Wall Street-based advice, because we believe it will have a bullish bias. For this reason we look to independent and unbiased sources. We spent considerable time this summer reviewing publications by the Economic Cycle Research Institute and Lombard Street Research and talking to their economists. Both organizations have done a good job in the past predicting downturns. Today, neither is ready to predict a recession. Lombard has an interesting take. They believe the recent recession was a result of global savings imbalances, led by Germany, Japan, and China. Their view is that these export nations created a trade surplus that had to be financed by deficits (in countries where consumers were willing to spend like the US). In order for this to be corrected in the long run, these nations will have to engage domestic consumers to be an increasing piece of their economic pies and rely less on exports for growth. This is the true solution to the economic crisis. China has started down this road already but the journey for Germany and Japan is more difficult. For more detail on Lombard’s view, we recommend Globalisation Fractures, by Charles Dumas.
Our managers generally continue to see a slow growth environment ahead. One of our managers is a dissenter and believes a double dip recession is likely. We believe having some exposure to all of these managers will result in a ride sufficiently comfortable to allow our clients to weather any coming storms.
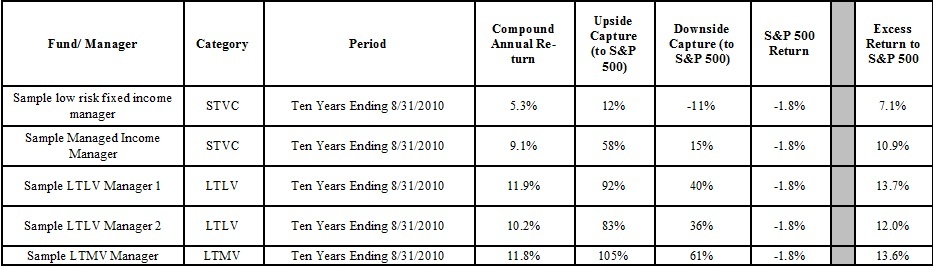
Portfolio Risk
A hasty analysis of a Global View portfolio could lead an investor to the incorrect conclusion that about its volatility, without further discussion. Our portfolios are constructed of funds that have historically illustrated excellent risk-adjusted returns over full market cycles by capitalizing on volatility. They have done this primarily by protecting against downside volatility. If our managers can deliver lower downside volatility and capture upside movement, they can provide better long-term returns. The table below shows an analysis we did in Morningstar showing the ten year track record of selected managers (if you are interested we can provide this for any manager that you might own and compare it!). For Example, Sample LTLV Manager returned 11.9% per year when the S&P 500 lost 1.8% per year. They did so by capturing 92% of the upside return of the S&P 500 (during months where the S&P 500 made positive returns) but only 40% of the downside of the S&P 500 (during months where the S&P 500 produced losses). This formula works best over multiple cycles because it gives more opportunity to capture positive returns – all that is needed to work is nonlinear returns, i.e. the S&P 500 cannot go up in a straight line. Investors are paid to endure this discomfort.


A snapshot report of our Moderately Aggressive allocation (using managers as allocated January, 2010 in the large tax deferred allocation) against a benchmark of 80% stocks and 20% bonds (Ibbotson Moderately Aggressive allocation), illustrates that our Moderately Aggressive allocation has substantially less equity, about 64%, than the Ibbotson benchmark. Moreover, the actual asset allocation has less equity than Morningstar illustrates because Morningstar does not reduce equity for some hedging, e.g. one our managers buys put options as insurance against downside risk, but this is not reflected in the Morningstar allocation.
To further illustrate how volatile markets allow our managers to add value, the chart below shows a comparison of a Sample LTLV Manager 1, Sample LTMV Manager, and the Vanguard 500 index total investment growth since market peak in mid October thru September 27, 2010. The Sample Managers are both positive, while the S&P 500 is still substantially down.

The long-term picture is revealed through a comparison over ten years. Investors in the S&P 500 would still be underwater, while the Sample Managers have more than doubled.

Focus on a New Fund We Selected for Clients in October of 2008
Those of you working with our advisors for nearly a decade (before Global View was formed) know how long our advisors may know how long we have been using some of our managers to our client’s benefit. You may also know we were some of the first investors in a new fund that was formed from a manager leaving a fund we used for years. We had already established a relationship with the new fund management and several of its analysts and were ready to use the fund when it opened, despite its lack of a performance history.
Since inception, this new fund has exhibited substantially less downside risk than the market. Its downside capture has been 32% of the S&P 500, but ¾ of its upside. This is highly illustrative of how our managers can provide a more comfortable ride and substantial outperformance. The chart below shows the degree of outperformance this fund experienced relative to the S&P 500 since fund inception:
To illustrate this in recent terms, the chart below shows how the newly selected fund moved from the April 25 peak this year thru the low on July 4th. The fund was down about 6.3% while the market was down about 15.7%, i.e. it had 40% of the downside risk of the market.
Is It a Good Time to Buy Bonds?
Investors seeking yield may be in for a rude surprise. According to a recent article, investors have poured more into bond funds over the last two years (about $500 billion) than they poured into equity funds during the internet bubble.
LINK: Bond Funds Gain Cash Like Stocks in Dot-Com Era
Given the notoriously poor performance of investors chasing returns, the question is begged whether it is a good time to chase bond performance. The chart below, using data from the Investment Company Institute, shows the nature of the inflows in comparison with equities.

The next chart shows that, after substantial inflows, bond yields have generally risen and bond prices have fallen.

We know that interest rates will eventually rise. When they do, bond prices fall. Assume an investor purchases a $1,000 bond with a yield of 5%. One year later, interest rates rise so that now a bond with similar features pays 6%. If the investor tried to sell the bond with a yield of 6% annually, nobody would buy it – the same amount of money could purchase an equivalent bond yielding 6%. In order to entice the buyer, the investor would have to discount the bond price to compensate the buyer for the lower coupon payments.
Selected Manager Updates
It is worth repeating how Global View classifies managers. We classify them as follows:
• Short-Term Volatility Control Managers (STVC): we believe these managers will have less volatility than the overall market and still afford the opportunity to gain reasonable returns; these managers may manage fixed income portfolios or mixed and equity portfolios seeking to reduce risk thru hedging.
• Long-Term Less Volatile Managers (LTLV) strive to manage volatility while beating relevant indexes over a full market cycle.
• Long-Term More Volatile Managers (LTMV) strive to beat relevant indexes over a full market cycle and may have volatility more similar to the broad stock market.
We may switch managers out for several reasons. First, we may believe the investing fundamentals necessitate a change. Second, we may find new managers and need to substitute them for existing managers. Third, we may believe the risk/ reward characteristics of a manager have declined and we may fire a manager or substitute it for a better manager.
Our clients have access to these updates. If you would like to inquire about becoming a client, please contact us at 864-272-0820.
Global View Team
Popular posts
-
 How to Calculate Your Break-Even Age June 21, 2021
 -
 2025 Year-End Tax Planning Checklist November 21, 2025
 -
.jpg) Roth Conversions: When They Make Sense and What You Should Consider January 07, 2026
Roth Conversions: When They Make Sense and What You Should Consider January 07, 2026 -
 One Big Beautiful Bill Act: Key Tax Changes You Should Know November 26, 2025