

“The farther backward you can look, the farther forward you are likely to see.” – Winston Churchill
I believe years from now, you will be happy with the strategies we employ with clients.
Because you may have forgotten, a reminder is overdue. I started working with retail clients near the top of the Dot Com bubble in 2000. Maybe I was lucky, but the market seemed very fishy to me. Clients who focused on fundamentals, in strategies like those currently employed at Grandeur Peak (then Wasatch), IVA and Centerstone (then First Eagle), and FPC Crescent, for example, did very well. But not in the beginning.
This is a story that plays over and over. It happened in 1999, then again in 2007. I believe it may be happening again. Sound investment strategies lagged causing many investors to bail. They then lost out. What is happening now has been expected, even if we don’t like it.
Don’t get me wrong. I have no idea whether recent activity is the beginning of a new bear market or just a correction.
Investors focused on how the “stock market” has done this year are missing the point. Not only have most equity investors lost money, but investors in the best performing stocks are taking more risk than they think. Because we are focused on not losing money that cannot be made back, we make sure investment strategies we employ focus on fundamentals that are tested over time.
And by over time we mean during the Great Depression, During the 1970s stagflation, during the Dot-Com bubble and through the Great Recession.
We know Keynes had positive returns during the Great Depression (Buffett wrote about it). We know Warren Buffett and the Superinvestors of Graham and Doddsville made money during the stagflationary period of the ’70s. We know managers we used made money during the Dot Com rout. And we know the strategies we used during the Great Recession of ’07-’09 suffered lower downside and rebounded much more quickly.
But during most of these periods, their strategies looked bad before they looked good. Sometimes for a while – remember the Dot Com bubble?
We know short-term performance is often luck. We’ve told clients this, but they don’t like to hear it. We get it. You think we are a hero when things are great, and a goat when they’re not. But because we haven’t found a strategy yet that we feel is both robust in the long-run and easy in the short-run, we don’t make the short-term our primary focus.
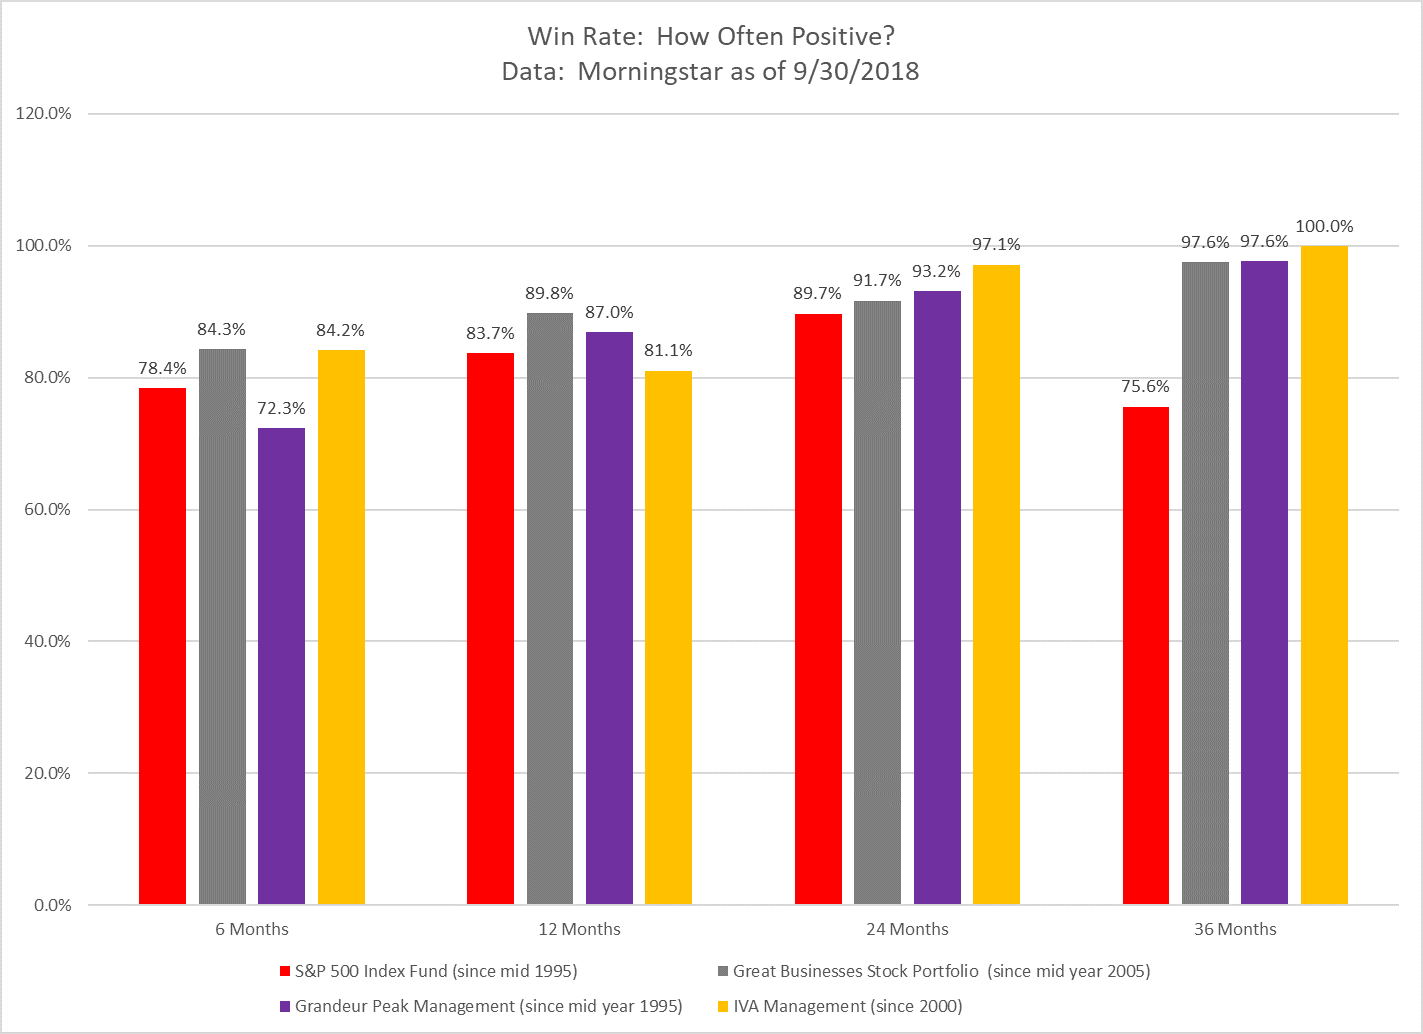
We continuously look at the record of the managers (and strategies) we employ to see how they did over time. We found they did a lot better, the longer time horizon we examined. Fundamental strategies we studied were up more than 97 percent of the time for three years. The market was down 17 percent of the time during that period (more than five times as often).
For example, the Robert Gardiner managed Wasatch Microcap Growth fund underperformed the S&P 500 by 61.9 percent for the three years ending April 30, 1999. Discouraged investors may have jumped ship and missed out on the next three years. For the next three years:
- S&P 500: - 16.4%
- Gardiner managed fund: +197.3%
While we don’t ever expect returns this good again, our message is that underperformance is almost always followed by outperformance. This story also played out for the managers we call “medium risk” at FPA and First Eagle (now IVA and Centerstone).
We saw a similar story play out in 2008 for the next three years, as clients who then owned the Wasatch Global Opportunities fund, IVA and FPA Crescent know.
While we don’t have as much data, we saw a similar story play out in our Great Business stock portfolio back test. The strategy lagged for the two years ending September 30, 2007. For the subsequent two years, the portfolio made 24.5 percent vs. a 29.9 percent loss for the S&P 500.
Because the stock portfolio was built on the same metrics to construct the Morningstar Wide Moat Focus index, it is useful to look at its history. The Morningstar Wide Moat focus index lagged the S&P 500 for the three years ending November 30, 2007 (later known as a market peak), only to return 15.5 percent for the next three years against the market, which lost 14.8 percent. That’s exactly what we know our clients want. And it’s exactly what improves their odds of achieving their retirement goals.
While we cannot predict the future, we can do everything in our power to improve your odds to have a good outcome, whatever happens. And we are. In stocks and in bonds. Because we know the laws of physics haven’t changed. And neither have the rules for making money in the long run.
Our clients own bonds too. Unless we have met and discussed it, they don’t know how well they are doing. Our decision to employ the mortgage-based strategies and private bonds has paid off very well even in a down bond market (due to rising rates).
Most Investors are Disappointed This Year
Unless you owned, disproportionately, tech stocks, your portfolio is negative this year. Recently, chinks appeared in tech armor too.
Even our moderate clients, who own the right bonds, the bulk of whose bond positions are up this year when the bond market is down 2.6 percent, may be underwater.
And there is a reason for this. The reason is that investors were overly optimistic on U.S. large tech stocks and overly pessimistic on about everything else. There are several reasons.
First, the president’s tough stance on trade, particularly with China, has introduced uncertainty for companies that trade in real goods. This is less true for service companies like tech firms that do not.
Second, the economy is growing beyond trend causing interest rates to rise.
This has caused nearly everything except tech companies to suffer more than fundamentals warrant. It also may have caused a flight to “quality” earnings because there is less uncertainty about the earnings of these technology companies, especially in a growing economy. And the economy is growing.
But what has not yet seemed to matter at all is valuations. We know that historically, valuations compress (fall) when interest rates rise. In recent conversations with portfolio managers, we learned that performance would have been better were they willing to hold on to positions that became overvalued, ignoring valuations. They didn’t because they know this creates a lot more downside risk in the future (like in 1999).
Some investors, especially new clients, mistakenly believe underperformance, or even some negative performance since market peaks (against the U.S. tech dominated indexes) means the portfolios are riskier. Nothing could be further from the truth.
We Know What Works in the Long-Term
We know what works because it has always worked. Always. We wrote about this back in 2009. Keynes did it during the Great Depression and World War II. Buffett did it during the stagflationary ’70s when the market couldn’t keep up with inflation. Jean Marie Eveillard together with proteges Charles de Vaulx (now at IVA) and Abhay Desphande (Centerstone) successfully navigated the Dot Com and Great Recession crises by having lower downside (when the dust settled) and faster recovery.
But it’s not simply “value.” Robert Gardiner (then at Wasatch managing several funds) also successfully navigated the Dot Com crisis using an approach more aligned toward earnings growth than value, but also considering quality and value as key fundamentals. In fact, in a recent conversation with Grandeur Peak, we were told their strategies would have performed much better this year if they were willing to ignore valuations (which they know helps in the short-term but punishes in the long-term).
And these strategies have always underperformed frothy market indexes going into these periods of overvaluation. Just as they are now.
Take a look at these recent blog posts:
What we Told Clients January 2009
Robert Gardiner note from 2017
Far too many clients focus on one variable: Short-term performance. This causes them to chase performance and give up half of the returns the market offers. What matters to the ODDS of your ability to mean your goals is reliability of performance over a reasonable time horizon. In other words, it’s both risk and reward.
Life is not a single variable game. Risk and reward both matter. What matters most is how likely an investment will work over a reasonable timeframe. When we looked at how often various strategies make money, we found there to be little difference over what happens in the short-run (it’s luck) but for fundamentally-based strategy to be more likely to make money over longer time horizons of two to three years.

Remember, to illustrate this, we had to take the track of the lead portfolio manager of Grandeur Peak back at Wasatch. We used U.S. index returns when data wasn’t available from January 2007 to November of 2009 (this makes the results appear worse). Similarly, we took the returns at First Eagle until IVA was formed in 2008 because the IVA portfolio manager was then a co-manager at First Eagle. This illustration is not intended to be a promise of future results. For the stock portfolio, we used the back-tested data back to mid-2005. Remember, the stock portfolio is based on metrics used to run actual models since 1994. Every one of these models beat the market over that long period. Moreover, Morningstar has run a Wide Moat Focus index since 2002 that has had unbelievable performance. Great Business stock portfolio was built on similar metrics but intended to be less risky and far lower turnover.
To put how much value-based strategies lag the overall market this year in perspective, it is useful to look at several Morningstar strategies offered since January 1994. Every strategy (other than Dangerous, which is intended to lose) has beaten the market since inception. Until fairly recently, the best performing strategy was “Valuation,” a strategy focused primarily on low valuation multiples but also considering earnings growth. This strategy is down 8.1 percent year-to-date. Every strategy they cover is down except Price Momentum, Asset Growth and Earnings Momentum.
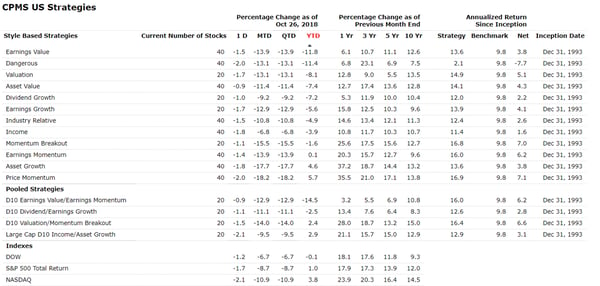
Please note, we do not use these strategies with clients because we find them unnecessarily risky. Instead, we follow them to get a read of how the market is reacting overall.
Clients concerned with underperformance versus the U.S. stock market (here S&P 500) might be reassured that strategies usually fully invested, like the Great Businesses or Grandeur Peak, may lag the b road U.S. market one-third of the time in periods shorter than two years, but about one-fourth of the time in three-year periods. Our “medium risk” strategies like IVA may lag significantly more when the market moves up quickly. It is ironic that they can also lag during periods of market frothiness, like of late.
In other words, when market valuations become stretched, strategies are more likely to zig when “the market” is zagging.
When we look at an investment manager (or develop a strategy), we want to make sure the portfolio is run the same way, is similar size, is still management owned and that we are not overlooking anything that may have fundamentally changed. While this can’t be a guarantee, it might give us some expectation about what could happen next, if the same rules of the universe are working.
Long-term clients remember the story of Jean-Marie Eveillard. Jean-Marie, at the helm of the First Eagle Global fund, had the best long-term risk/reward performance of any manager we studied. He managed to gain positive returns (within -1 percent) for every calendar year from 1979 to 2007, beating broad market indexes by more than 3 percent p.a. However, because he was so successful during 2000-2003, the fund became substantially larger, morphing into a larger fund that can no longer make the same kind of bets Jean-Marie made. Under Jean-Marie’s tenure, the fund could buy shares of small cap companies and underpriced bonds. As the fund became larger, this became increasingly difficult to do without moving the price of those securities!
This happens to a lot of good funds. They become obese after good performance – not unlike a lot of successful business folks! To be clear, First Eagle funds may continue to do quite well. It’s just harder now.
There is good news. Historically, whenever fundamentally based portfolios have underperformed, subsequent performance has been good looking out two years or more. But in the next six months or even year, more underperformance may be in order.
It’s why we make sure every investment strategy we use (whether our stock portfolio or global equity managers) is based on these fundamentals:
- Growth
- Quality
- Valuation
This is a multiple variable game. It is not useful to talk about “valuation” without considering context. Context is the quality (willing to pay more for steady earnings) and growth prospects (willing to pay more for likely future earnings). This is a difficult calculus few can make consistently.
But is the environment substantially different? The environment is always changing, but consistent application of fundamentals ensures this is reflected in company selection!
And while there is little doubt that the President means business with China, there is also little doubt that our global managers (and Morningstar analysts) know this. In general, the managers avoid owning state owned enterprises and they avoid owning companies whose earnings are dependent on unrealistic views of commodity prices. While there may be some misses (some growth stocks get missed, some value stocks are bought too early) the historical validation of this approach is significant.
Recent Volatility Has Created Opportunity
The spread between the return of cheaper (value) and higher growing (growth) stocks is at levels not seen for years, like back in 1999.
The U.S. stock market is 62.5 percent of the world stock market. Yet it only represents only about 25 percent of the global economy.
In the stock market, I can’t imagine anything more foolish than focusing on U.S. growth stocks. Especially because the disparity between returns of U.S. Growth and Foreign Value is 17.0 percent year-to-date and between U.S. Growth and U.S. Value is 9.5 percent. This is especially rare.
This kind of regret is unavoidable. One 30-year veteran, Steve Romick, at FPA puts it this way:
“There is a price for conservatism for a period, followed by a shrinking business. We are fearful of neither.”
Our investment thesis is well-formulated. We know that investors get paid well for owning great companies. Great companies have the right mix of value, growth and quality. While we use many differing strategies to access this, they have all generally been very successful during three-year rolling periods.
These strategies have done well in absolute terms – made money – or in relative terms – beat “the market” – over most periods. But not over all periods.
To illustrate this, I did a study comparing the returns of various strategies compared to the U.S. Stock Market (S&P 500). The findings were positively surprising.
First, the ability of even the highest risk strategies we use were positive 97 percent versus the market about 75 percent (analyzing three-year rolling period). For example, the strategies we monitored run by Robert Gardiner and now his team at Grandeur Peak were positive 98 percent of the time since June 1995. Our Great Business stock portfolio (for which we have a back-tested track based on actual fundamentals used since 1995) was positive 97 percent of the time since June 2006.
It may also be useful to look at the worst performing three-year periods. For the three years ending March 2009, Great Businesses would have been -11 percent. The worst period for the S&P 500 was -39 percent. Recovery from an 11 percent loss took only a gain of 12 percent (which happened in a matter of months). Recovery from a loss of 39 percent took a gain of 63 percent, which took years.
We analyzed this extensively and found short-term correlations to be generally irrelevant (and often inversely correlated) to short-term performance. Which means it is almost always a signal for a buying opportunity.
Periods of Opportunity Have Been Followed by Excellent Performance (Even in Down Markets)
Now imagine you are “underperforming” in 1998, 1999 or 2007.
Because we have a track back to 1995, we can look at the period going into the dot com bubble. It is no surprise that the worst underperformance for the Robert Gardiner managed Wasatch Microcap Growth fund he managed happened for the three years ending April 2000 when it trailed the broad U.S. S&P 500 by more than 61.9 percent (but still made a respectable 52.8 percent or more than 19 percent per year). We were (positively) surprised to find the subsequent three-year period the Gardiner managed portfolio made 197.3 percent (more than 25 percent per year) when the S&P 500 lost 16.3 percent (6 percent per year).
Currently, the Robert Gardiner supervised Grandeur Peak Global Opportunities fund (now closed to new investors) lags the S&P 500 by 18.0 percent in the last three years. And we know that on average, when his portfolios lagged the market, subsequent outperformance was on average over 150 percent. We cannot know the future, but we do know Grandeur Peak portfolios are managed similarly, if not better, with a wider fishing net (it’s a global net now).
I ran these analyses to show how our “higher risk” portfolios and managers sometimes zig when the market zags. The zigging and zagging are more frequent over short intervals. The most important take away is they have historically been more likely to make money over reasonable time horizons. The second most important take away is that, when they underperform, they are likely to subsequently outperform.
I know this is hard to follow, but we can show you the work.
Investors Own Bonds Too
Investors don’t have all their money in stocks. Fortunately, our call to avoid interest rate risk last year has worked beautifully. Because we know half of bond investors are not trying to make money (regulations and other non-pecuniary motivations nearly guarantee they won’t do well) we can focus on the areas of lending most profitable for our clients.
Remember, bonds trade on fundamentals too: credit quality, interest rate risk and liquidity and complexity premiums.
This link might be a good refresher: Investing Differently in Bonds to Make Money when Rates are Rising
Summing It Up
Human beings are not wired to think in multi-variables. We see return but forget risk. We see the recent past and ignore the long-term. That’s why most investors leave about half of the returns the stock (and bond) markets offer. We look at performance and wish we had what we believe others got or that we may have gotten with a small percentage of our portfolio. This is not new, but everyone needs a reminder.
Our strategies are sound, based on sound fundamentals. We won’t always be right, but we are convinced we are making the right decisions on a portfolio level.
However, if you have experienced a life-changing event, like loss of a loved-one or a sudden deterioration in health, it might be a good time to revisit your risk tolerance and adjust your portfolio.
We are here to talk whenever you need us.


Written by Ken Moore
Ken’s focus is on investment strategy, research and analysis as well as financial planning strategy. Ken plays the lead role of our team identifying investments that fit the philosophy of the Global View approach. He is a strict adherent to Margin of Safety investment principles and has a strong belief in the power of business cycles. On a personal note, Ken was born in 1964 in Lexington Virginia, has been married since 1991. Immediately before locating to Greenville in 1997, Ken lived in New York City.
Popular posts
-
 How to Calculate Your Break-Even Age June 21, 2021
 -
 2025 Year-End Tax Planning Checklist November 21, 2025
 -
.jpg) Roth Conversions: When They Make Sense and What You Should Consider January 07, 2026
Roth Conversions: When They Make Sense and What You Should Consider January 07, 2026 -
 One Big Beautiful Bill Act: Key Tax Changes You Should Know November 26, 2025